Reference Datasets
Important
Reference data are not normative data. The datasets below are third-party maps from
other studies and other people: PET maps are group averages of usually small, selected
samples with study-specific methods, and post-mortem data (gene expression, cell types,
histology) come from one to a few donors. Every colocalization analysis nevertheless treats a
reference map as if it represented the spatial distribution of that measure in the studied
population. This assumption can rarely be tested and should be stated as a limitation in any
study using these data. Describe each map by what it is (tracer and target, sample, source;
see fetch_map_info()) and avoid terms like “normative PET maps”.
See also the concept notebook.
Important
Many of the datasets below are subject to attribution licenses. When fetching data via the API, NiSpace prints all required citations to the terminal. If you use multiple maps, all associated DOIs must be cited — use nispace.datasets.fetch_metadata() for per-map details.
NiSpace provides the following built-in reference datasets. Fetch them via nispace.datasets.fetch_reference():
from nispace.datasets import fetch_reference
pet = fetch_reference("pet", collection="OnePerTarget",
                      parcellation="Schaefer200")
Note
Linked items point to files or folders in the NiSpace data repository.
Would you like to use the brain plots shown below in your publication? You can! They were generated with nispace.plotting.brainplot() and can be fetched via the API with nispace.datasets.fetch_plot(). You are allowed to modify them further, but please attribute NiSpace as the source.
| Key | Description | Maps | Precomputed parcellations | Collections |
|---|---|---|---|---|
bigbrain | The NiSpace "BigBrain" dataset contains histological, microstructural, and functional differentiation maps. | 13 | 19 | 3 |
celltypes-pak2024 | The NiSpace "CellTypes-Pak2024" dataset contains whole-brain maps of the relative abundance of six canonical cell types (astrocytes, endothelial cells, microglia, neurons, oligodendrocytes, and oligodendrocyte precursor cells) as published by Pak et al. (2024). | 6 | 27 | 1 |
celltypes-zhang2025 | The NiSpace "CellTypes-Zhang2025" dataset contains cortical abundances of 24 cell types (9 excitatory, 9 inhibitory, 6 non-neuronal) as published by Zhang et al. (2025). | tab. | 16 | 4 |
cortexfeatures | The NiSpace "CortexFeatures" dataset consists of different features of cortical topology, most of them available via neuromaps. | 25 | 19 | 4 |
enigmaarea | The NiSpace "ENIGMAarea" dataset is based on ENIGMA analyses of brain structure across several neuro-psychiatric disorders. | tab. | 2 | 2 |
enigmathick | The NiSpace "ENIGMAthick" dataset is based on ENIGMA analyses of brain structure across several neuro-psychiatric disorders. | tab. | 2 | 2 |
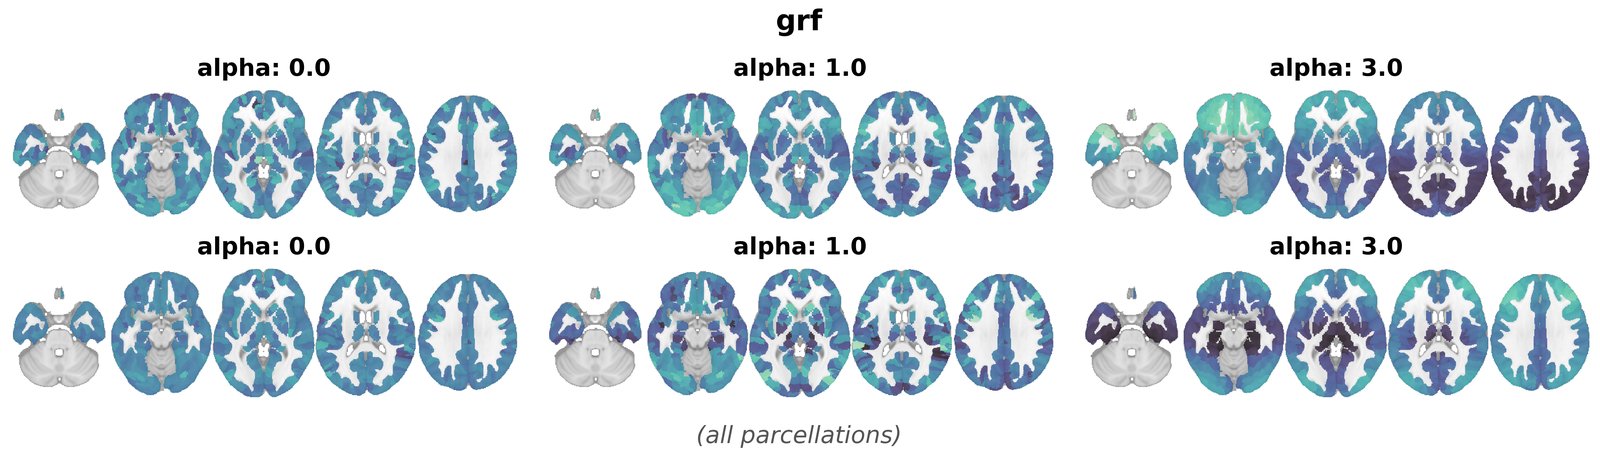
grf | The NiSpace "GRF" dataset consists of Gaussian Random Field Maps (GRFs) generated with varying spatial smoothness. | tab. | 27 | 4 |
hcptask | HCP S1200 group-average task-fMRI maps (Cohen's d; 997 subjects; MSMAll, 2mm smoothing) from BALSA (reference pkXDZ); 47 conditions and contrasts (HCP's 39 sign-flipped duplicates omitted). | 47 | 27 | 5 |
mabaseline | The NiSpace "MABaseline" dataset contains meta-analytic "reporting baseline" maps as introduced with the C-SALE method (Magielse et al., 2025). | 1 | 27 | 1 |
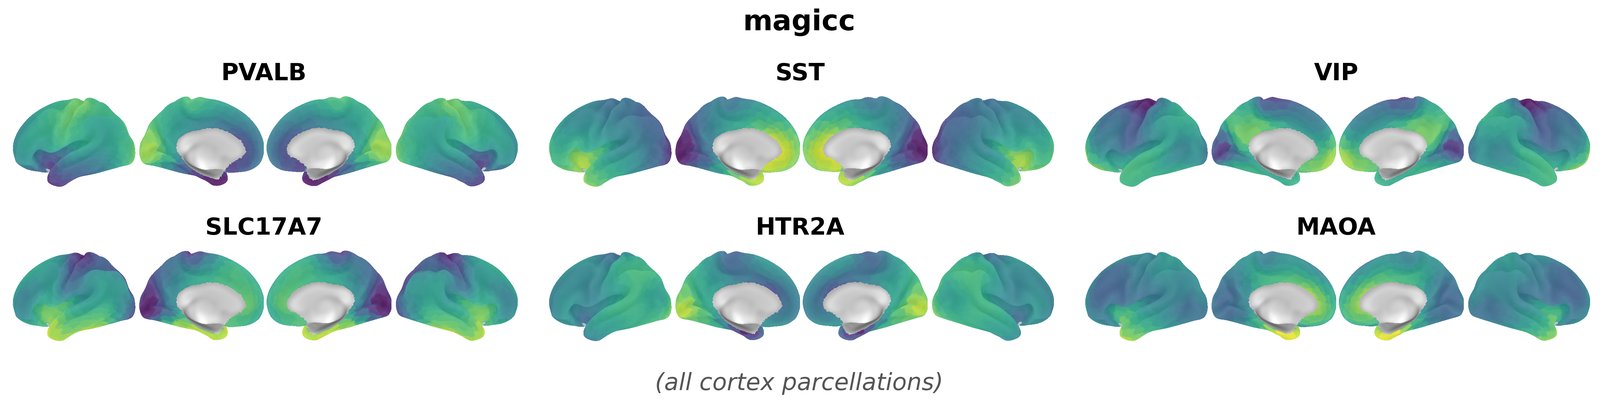
magicc | The NiSpace "MAGICC" dataset contains cortical gene expression maps for > 10,000 genes based on a continuous reconstruction. | tab. | 19 | 22 |
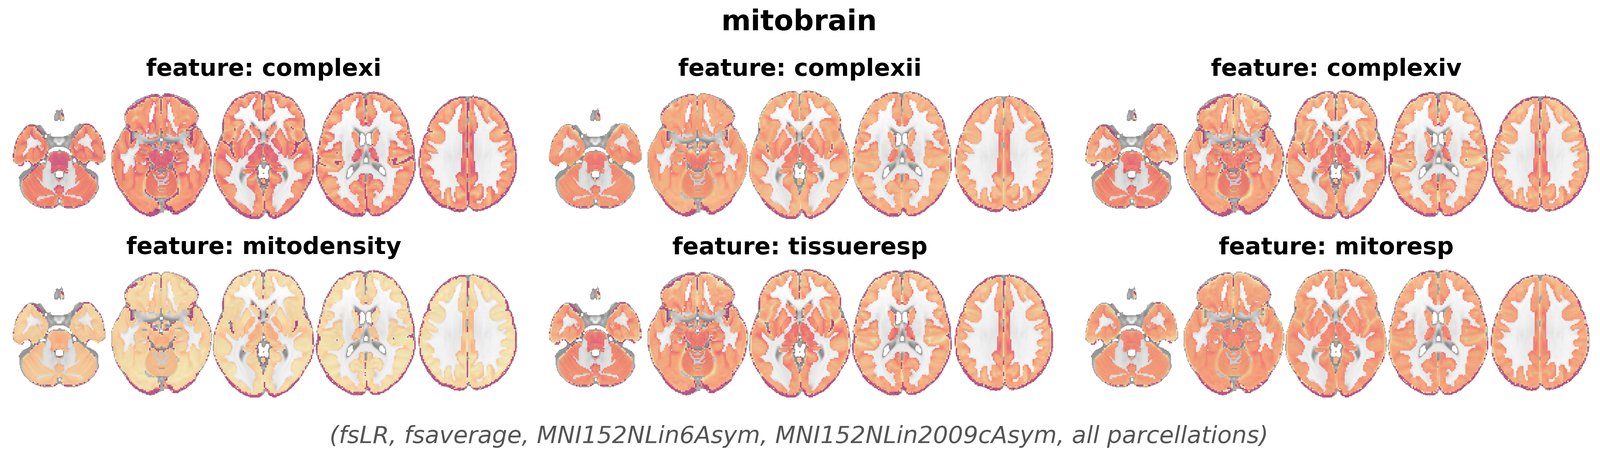
mitobrain | The NiSpace "MitoBrain" datasets contains mitochondrial phenotypes reconstructed from histological data. | 6 | 27 | 1 |
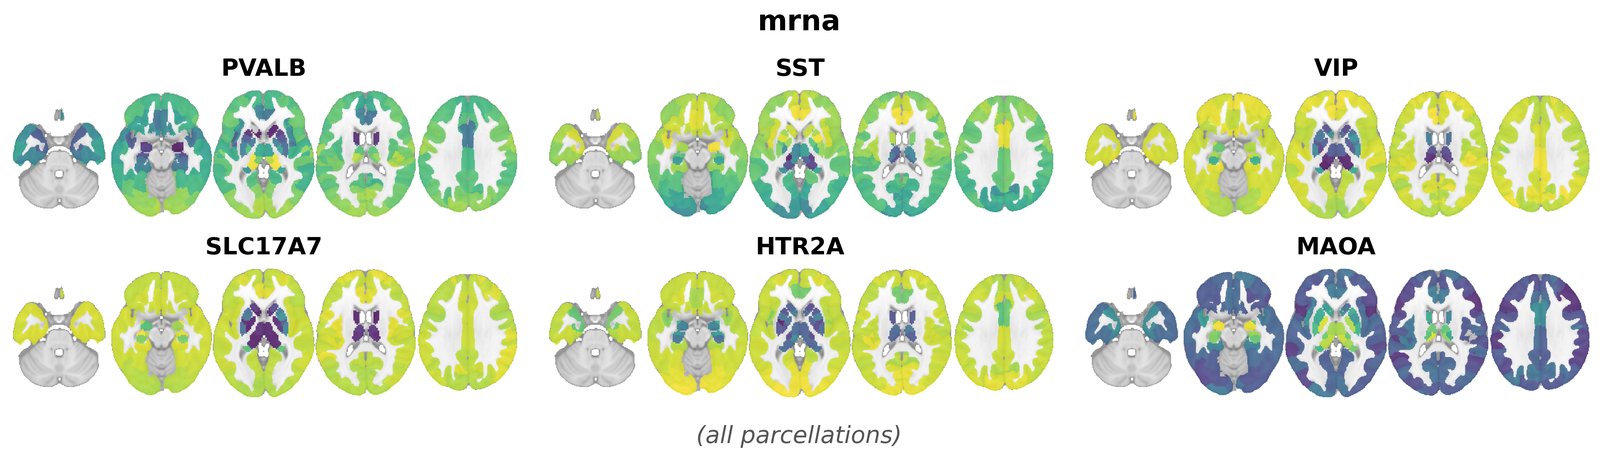
mrna | The NiSpace "mRNA" dataset contains whole-brain gene expression maps for > 10,000 genes based on parcel-wise mapping. | tab. | 27 | 22 |
neurosynth | The NiSpace "Neurosynth" dataset contains > 1,000 meta-analytic maps for terms from the Neurosynth database. | tab. | 27 | 2 |
pet | The NiSpace "PET" dataset contains a growing collection of nuclear imaging maps from different source publications. | 49 | 27 | 9 |
rsn | The NiSpace "RSN" dataset is based on resting-state network probability maps generated by Dworetsky et al., 2021. | 14 | 19 | 1 |
rsn17 | The NiSpace "RSN17" dataset contains resting-state network probability maps describing the 17 "Kong" networks. | 17 | 19 | 1 |
tpm | The NiSpace "TPM" dataset is based on openly available tissue probability maps collected from different sources. | 5 | 27 | 1 |
See nispace.datasets.fetch_metadata() to retrieve detailed per-map metadata (tracers, publications, licenses) for datasets that carry it (e.g. pet).
Tip
Most datasets ship with collections — curated subsets of maps. Pass the collection argument to fetch_reference() to load only the maps in a given collection. Each dataset’s collection table below says what a collection contains and what it is for:
Without sets (one row per map, e.g.
OnePerTarget): for colocalization.With sets (e.g.
OnePerTarget-Sets): for set enrichment (XSEA) only. Sets may overlap, so a plain colocalization would analyze such maps once per set.fetch_reference(..., set_by="target")groups the maps of any collection into sets by an entity of their name (here: one set per target).
from nispace.datasets import fetch_reference, fetch_collection
pet = fetch_reference("pet", collection="OnePerTarget",
                      parcellation="Schaefer200")
# overlapping sets, for set enrichment (XSEA) only
colls = fetch_collection("OnePerTarget-Sets", dataset="pet")
BigBrain
The NiSpace "BigBrain" dataset contains histological, microstructural, and functional differentiation maps. The data is adopted from the BigBrainWarp toolbox (https://bigbrainwarp.readthedocs.io) by Paquola et al. The maps are fetched directly from the BigBrainWarp Sciebo folder (space="fsaverageOriginal") or downloaded from the NiSpace-data GitHub repo (space="fsLR" or "fsaverage"; recommended). The data is subject to a CC BY-NC-SA 4.0 license. Please cite the appropriate original publication for each map when used (see map info table).
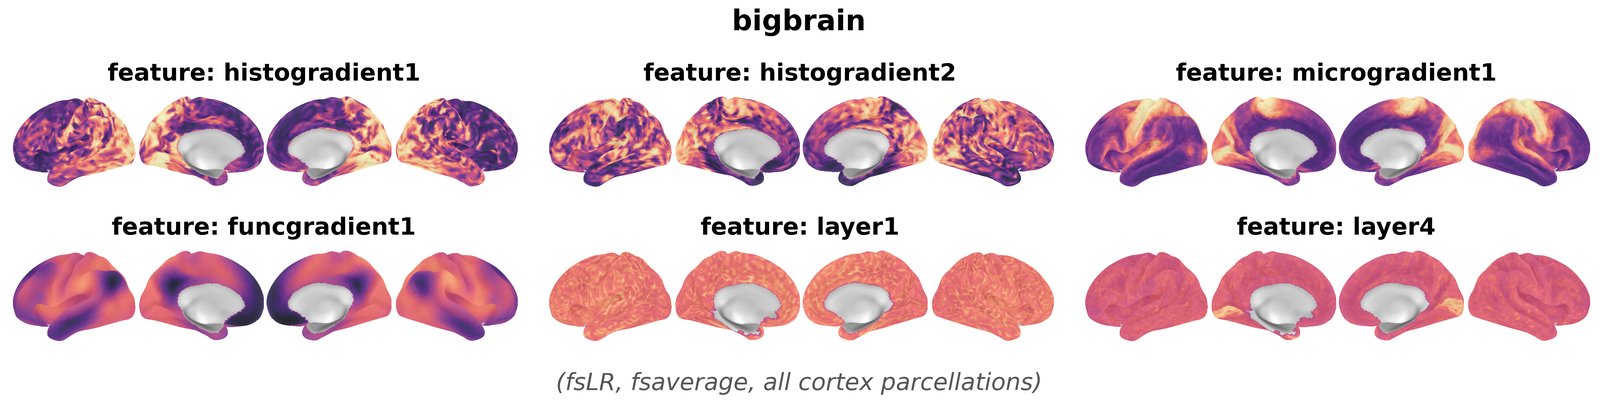
Coverage: Cortex only
Individual maps: 13
Precomputed for: AALCortical, BrainnetomeCortical, DesikanKilliany, DesikanKillianyTourville, Destrieux, Glasser, HarvardOxfordCortical, Schaefer1000Parcels17Networks, Schaefer1000Parcels7Networks, Schaefer100Parcels17Networks, Schaefer100Parcels7Networks, Schaefer200Parcels17Networks, Schaefer200Parcels7Networks, Schaefer400Parcels17Networks, Schaefer400Parcels7Networks, Yan100, Yan1000, Yan200, Yan400
Collections: 3 (see table below)
Metadata: metadata.csv
References: Amunts et al., 2013 · Paquola et al., 2021
License: CC BY-NC-SA 4.0
Show all 3 collections
| Collection | Content and use |
|---|---|
All | All BigBrain histological maps (cortical layers and differentiation gradients). |
CorticalLayers | Cortical layer density maps for layers 1–6 (Wagstyl et al., 2020). |
DifferentiationGradients | Histological, microstructural, and functional cortical differentiation gradients (Paquola et al., 2021). |
Show all 13 maps
| Map | Available spaces |
|---|---|
feature-funcgradient1_pub-paquola2021 | fsaverage, fsLR |
feature-funcgradient2_pub-paquola2021 | fsaverage, fsLR |
feature-funcgradient3_pub-paquola2021 | fsaverage, fsLR |
feature-histogradient1_pub-paquola2021 | fsaverage, fsLR |
feature-histogradient2_pub-paquola2021 | fsaverage, fsLR |
feature-layer1_pub-wagstyl2020 | fsaverage, fsLR |
feature-layer2_pub-wagstyl2020 | fsaverage, fsLR |
feature-layer3_pub-wagstyl2020 | fsaverage, fsLR |
feature-layer4_pub-wagstyl2020 | fsaverage, fsLR |
feature-layer5_pub-wagstyl2020 | fsaverage, fsLR |
feature-layer6_pub-wagstyl2020 | fsaverage, fsLR |
feature-microgradient1_pub-paquola2021 | fsaverage, fsLR |
feature-microgradient2_pub-paquola2021 | fsaverage, fsLR |
CellTypes-Pak2024
The NiSpace "CellTypes-Pak2024" dataset contains whole-brain maps of the relative abundance of six canonical cell types (astrocytes, endothelial cells, microglia, neurons, oligodendrocytes, and oligodendrocyte precursor cells) as published by Pak et al. (2024). Maps were reconstructed from Allen Human Brain Atlas (AHBA) bulk microarray data by Gaussian-process interpolation of 80 cell-type marker genes to all gray matter voxels and marker-gene-based deconvolution (BRETIGEA); per voxel, cell-type values sum to one and are scaled by gray matter density. Original maps are retrieved from the authors' GitHub repository (https://github.com/neuropm-lab/cellmaps; space MNIOriginal, 1.5mm SPM MNI grid, treated as MNI152NLin6Asym), resampled to 2mm MNI152NLin6Asym space and masked, and transformed to MNI152NLin2009cAsym, fsLR, and fsaverage spaces.

Coverage: Cortex + subcortex
Individual maps: 6
Precomputed for: AALCortical, AALSubcortical, Aseg, BrainnetomeCortical, BrainnetomeSubcortical, DesikanKilliany, DesikanKillianyTourville, Destrieux, Glasser, HarvardOxfordCortical, HarvardOxfordSubcortical, Schaefer1000Parcels17Networks, Schaefer1000Parcels7Networks, Schaefer100Parcels17Networks, Schaefer100Parcels7Networks, Schaefer200Parcels17Networks, Schaefer200Parcels7Networks, Schaefer400Parcels17Networks, Schaefer400Parcels7Networks, TianS1, TianS2, TianS3, TianS4, Yan100, Yan1000, Yan200, Yan400
Collections: 1 (see table below)
References: Pak et al., 2024 · Hawrylycz et al., 2012
License: CC BY 4.0
Show all 1 collections
| Collection | Content and use |
|---|---|
All | Six whole-brain canonical cell-type abundance maps (Pak et al., 2024). |
Show all 6 maps
| Map | Available spaces |
|---|---|
cell-astrocytes_pub-pak2024 | MNI152NLin6Asym, MNI152NLin2009cAsym, fsLR, fsaverage |
cell-endothelial_pub-pak2024 | MNI152NLin6Asym, MNI152NLin2009cAsym, fsLR, fsaverage |
cell-microglia_pub-pak2024 | MNI152NLin6Asym, MNI152NLin2009cAsym, fsLR, fsaverage |
cell-neurons_pub-pak2024 | MNI152NLin6Asym, MNI152NLin2009cAsym, fsLR, fsaverage |
cell-oligodendrocytes_pub-pak2024 | MNI152NLin6Asym, MNI152NLin2009cAsym, fsLR, fsaverage |
cell-opc_pub-pak2024 | MNI152NLin6Asym, MNI152NLin2009cAsym, fsLR, fsaverage |
CellTypes-Zhang2025
The NiSpace "CellTypes-Zhang2025" dataset contains cortical abundances of 24 cell types (9 excitatory, 9 inhibitory, 6 non-neuronal) as published by Zhang et al. (2025). Cell-type fractions were imputed for each Allen Human Brain Atlas (AHBA) cortical bulk microarray sample with CIBERSORTx, using the single-nucleus RNA-seq data of Jorstad et al. (2023) as reference, and samples were mapped to the fsLR 32k surface. NiSpace recomputes parcel-wise values from these sample-level data (https://github.com/XihanZhang/human-cellular-func-con), following the authors' approach (exclusion of samples >4 mm from the surface; average of all samples within a parcel). Samples were additionally mirrored across hemispheres. Parcels without samples are NaN. Map names follow the Jorstad et al. (2023) subclass names (e.g., "cell-L23IT" for L2/3 IT neurons, "cell-Pvalb" for PVALB interneurons, "cell-MicroPVM" for microglia/perivascular macrophages), with the Jorstad et al. (2023) class given as "class-excitatory", "class-inhibitory", or "class-nonneuronal". The data are used with permission of the authors; please cite the original publication.

Coverage: Cortex only
Precomputed for: AALCortical, BrainnetomeCortical, DesikanKilliany, DesikanKillianyTourville, Destrieux, Glasser, HarvardOxfordCortical, Schaefer100Parcels17Networks, Schaefer100Parcels7Networks, Schaefer200Parcels17Networks, Schaefer200Parcels7Networks, Schaefer400Parcels17Networks, Schaefer400Parcels7Networks, Yan100, Yan200, Yan400
Collections: 4 (see table below)
References: Zhang et al., 2025 · Jorstad et al., 2023 · Hawrylycz et al., 2012
License: attribution (by permission)
Show all 4 collections
| Collection | Content and use |
|---|---|
All | All 24 cortical cell-type abundance maps imputed with the Jorstad et al. (2023) reference (Zhang et al., 2025). |
Excitatory | Nine excitatory neuron cell types. |
Inhibitory | Nine inhibitory neuron cell types. |
NonNeuronal | Six non-neuronal cell types. |
CortexFeatures
The NiSpace "CortexFeatures" dataset consists of different features of cortical topology, most of them available via neuromaps. Many of these maps were used in Shafiei et al., 2023. The neuromaps maps are fetched directly from neuromaps (space="fsLROriginal" or "fsaverageOriginal") or downloaded from the NiSpace-data GitHub repo (space="fsLR" or "fsaverage"; recommended). The structural maps of the Human Connectome Project (HCP) S1200 release (cortical thickness, T1w/T2w ratio, sulcal depth, curvature; 1096 subjects, MSMAll registration) were obtained from the S1200 group-average data on BALSA and converted to GIFTI (fsLR) and transformed to fsaverage. Note that the HCP sulcal depth and curvature maps follow the HCP sign convention (negative = sulcal, positive = gyral), which is inverted relative to FreeSurfer. Please cite neuromaps (https://neuromaps-main.readthedocs.io/) and the original publication for each map when used. For HCP maps, please include the HCP acknowledgment ("Data were provided [in part] by the Human Connectome Project, WU-Minn Consortium (Principal Investigators David Van Essen and Kamil Ugurbil; 1U54MH091657) funded by the 16 NIH Institutes and Centers that support the NIH Blueprint for Neuroscience Research; and by the McDonnell Center for Systems Neuroscience at Washington University.").
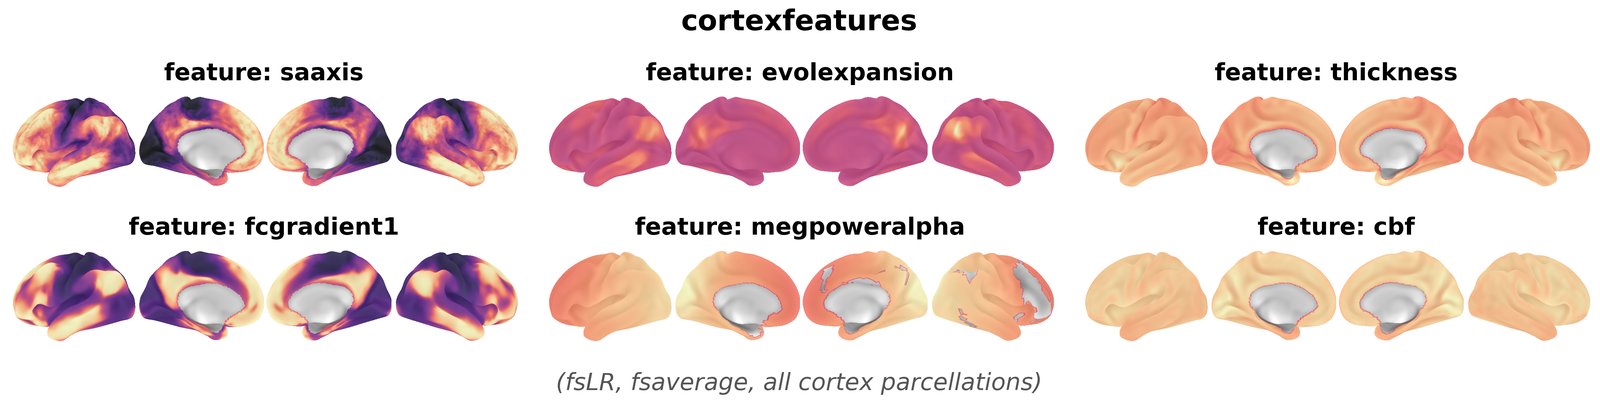
Coverage: Cortex only
Individual maps: 25
Precomputed for: AALCortical, BrainnetomeCortical, DesikanKilliany, DesikanKillianyTourville, Destrieux, Glasser, HarvardOxfordCortical, Schaefer1000Parcels17Networks, Schaefer1000Parcels7Networks, Schaefer100Parcels17Networks, Schaefer100Parcels7Networks, Schaefer200Parcels17Networks, Schaefer200Parcels7Networks, Schaefer400Parcels17Networks, Schaefer400Parcels7Networks, Yan100, Yan1000, Yan200, Yan400
Collections: 4 (see table below)
Metadata: metadata.csv
References: Markello et al., 2022 · Shafiei et al., 2023 · Glasser et al., 2013
License: CC BY-NC-SA 4.0 (21 maps), HCP Open Access Data Use Terms (4 maps)
Show all 4 collections
| Collection | Content and use |
|---|---|
All | All cortical feature maps. |
MEG | MEG power spectra and timescale maps (Shafiei et al., 2022). |
Metabolism | Different features of cortical metabolism (Vaishnavi et al., 2010). |
CortexOrganisation | Different features of cortical organisation (various sources). |
Show all 25 maps
ENIGMAarea
The NiSpace "ENIGMAarea" dataset is based on ENIGMA analyses of brain structure across several neuro-psychiatric disorders. The original data is provided via the ENIGMA Toolbox v2.0.3 (https://github.com/MICA-MNI/ENIGMA). It contains Cohen's d effect sizes (d_icv, largely ICV-corrected) for case-vs-control differences in cortical surface area and subcortical volume. Cortical values are provided in the Desikan parcellation, subcortical values in the Aseg parcellation. For some disorders, effect size maps are split by subtype and/or age group. Use collection "Main" for a reduced collection of the main effect size maps. For each disorder, please cite the appropriate ENIGMA working group publication (see map info table).
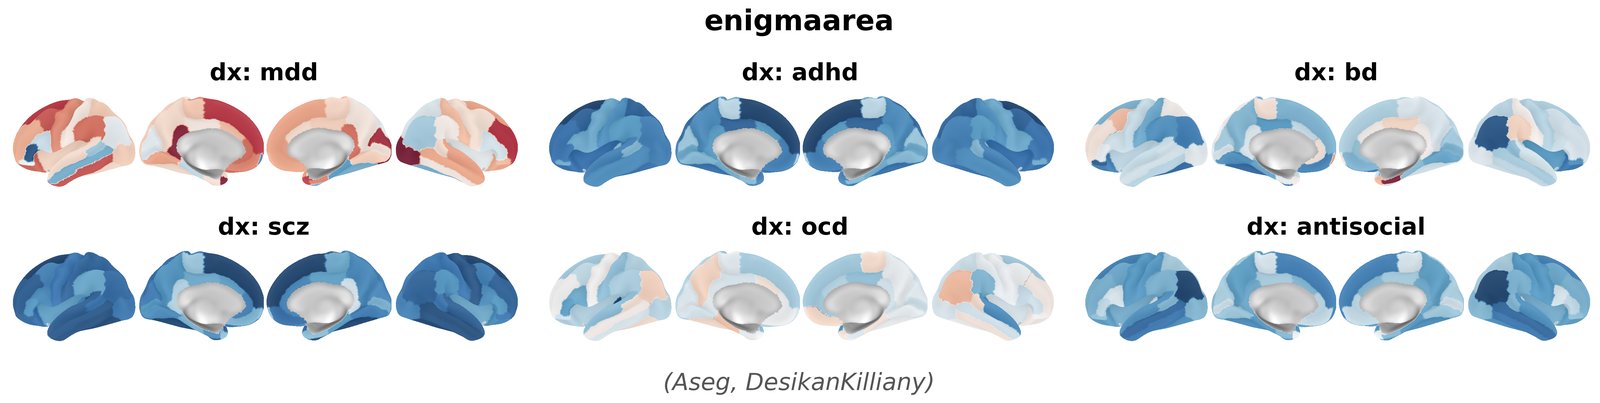
Coverage: Cortex + subcortex
Precomputed for: DesikanKilliany, Aseg
Collections: 2 (default Main; see table below)
Metadata: metadata.csv
References: Larivière et al., 2021
License: BSD 3-Clause
ENIGMAthick
The NiSpace "ENIGMAthick" dataset is based on ENIGMA analyses of brain structure across several neuro-psychiatric disorders. The original data is provided via the ENIGMA Toolbox v2.0.3 (https://github.com/MICA-MNI/ENIGMA). It contains Cohen's d effect sizes (d_icv, largely ICV-corrected) for case-vs-control differences in cortical thickness and subcortical volume. Cortical values are provided in the Desikan parcellation, subcortical values in the Aseg parcellation. For some disorders, effect size maps are split by subtype and/or age group. Use collection "Main" for a reduced collection of the main effect size maps. For each disorder, please cite the appropriate ENIGMA working group publication (see map info table).
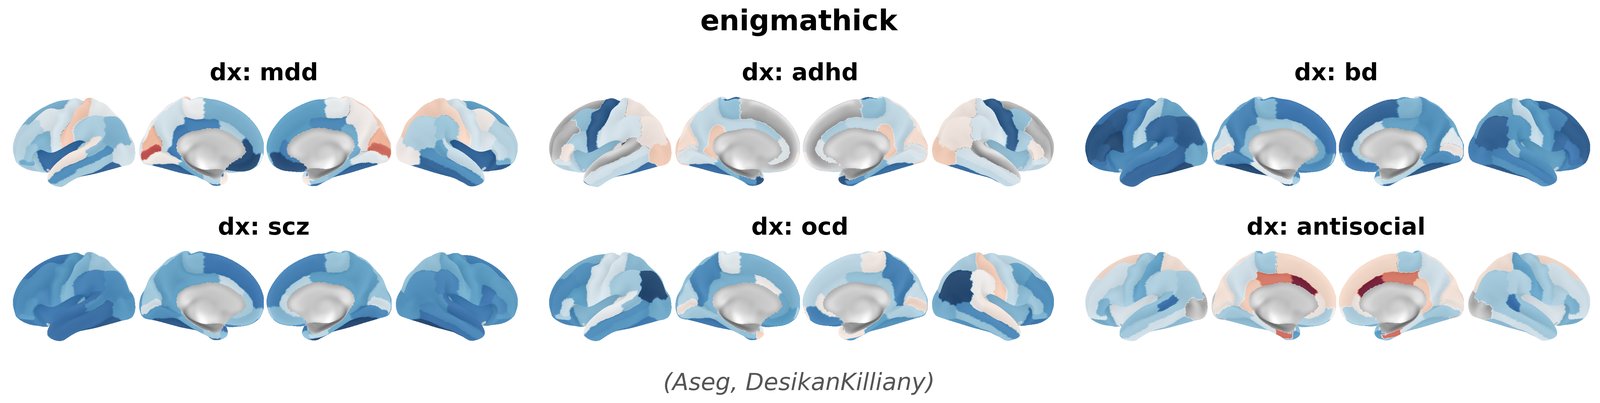
Coverage: Cortex + subcortex
Precomputed for: DesikanKilliany, Aseg
Collections: 2 (default Main; see table below)
Metadata: metadata.csv
References: Larivière et al., 2021
License: BSD 3-Clause
GRF
The NiSpace "GRF" dataset consists of Gaussian Random Field Maps (GRFs) generated with varying spatial smoothness. The parameter "alpha" controls the smoothness of the field and therefore the spatial autocorrelation of the resulting brain maps. The maps are mirrored across hemispheres exactly at MNI coordinate (0,0,0). There are 10,000 maps for each of the four smoothness levels (alpha=0, 1, 2, 3; alpha=0 being spatially unstructured white noise). The code was adopted from Markello et al., 2021 and Burt et al., 2020.
Coverage: Cortex + subcortex
Precomputed for: AALCortical, AALSubcortical, Aseg, BrainnetomeCortical, BrainnetomeSubcortical, DesikanKilliany, DesikanKillianyTourville, Destrieux, Glasser, HarvardOxfordCortical, HarvardOxfordSubcortical, Schaefer1000Parcels17Networks, Schaefer1000Parcels7Networks, Schaefer100Parcels17Networks, Schaefer100Parcels7Networks, Schaefer200Parcels17Networks, Schaefer200Parcels7Networks, Schaefer400Parcels17Networks, Schaefer400Parcels7Networks, TianS1, TianS2, TianS3, TianS4, Yan100, Yan1000, Yan200, Yan400
Collections: 4 (default ByAlpha; see table below)
References: Markello et al., 2021 · Burt et al., 2020
License: CC BY 4.0
Show all 4 collections
| Collection | Content and use |
|---|---|
All | 40000 Gaussian random fields (10k per smoothness level; alpha=0, 1, 2, 3). |
Alpha0 | 10000 spatially unstructured (white noise) GRFs (alpha=0). |
ByAlphadefault | All 40000 GRFs grouped by smoothness parameter (alpha). |
ByAlpha1000 | 1000 GRFs for each smoothness level alpha, grouped by alpha. |
HCPTask
HCP S1200 group-average task-fMRI maps (Cohen's d; 997 subjects; MSMAll, 2mm smoothing) from BALSA (reference pkXDZ); 47 conditions and contrasts (HCP's 39 sign-flipped duplicates omitted). Map images are cortical (fsLR, fsaverage); subcortical data (incl. cerebellum, brainstem) is only available as parcellated tables for subcortical parcellations. The "Canonical" collection selects the key contrasts from each task (Barch et al., 2013). Cite the original HCP papers and include the HCP acknowledgment if you use the maps in any publication (see HCP Open Access Data Use Terms).

Coverage: Cortex + subcortex
Individual maps: 47
Precomputed for: AALCortical, AALSubcortical, Aseg, BrainnetomeCortical, BrainnetomeSubcortical, DesikanKilliany, DesikanKillianyTourville, Destrieux, Glasser, HarvardOxfordCortical, HarvardOxfordSubcortical, Schaefer1000Parcels17Networks, Schaefer1000Parcels7Networks, Schaefer100Parcels17Networks, Schaefer100Parcels7Networks, Schaefer200Parcels17Networks, Schaefer200Parcels7Networks, Schaefer400Parcels17Networks, Schaefer400Parcels7Networks, TianS1, TianS2, TianS3, TianS4, Yan100, Yan1000, Yan200, Yan400
Collections: 5 (set enrichment All-Sets; see table below)
Metadata: metadata.csv
References: Barch et al., 2013 · Van Essen et al., 2013 · Glasser et al., 2013
License: HCP Open Access Data Use Terms
Show all 5 collections
| Collection | Content and use |
|---|---|
All | All 47 HCP task-fMRI maps (conditions vs. baseline and contrasts). |
Canonical | The focused contrast of each task (Barch et al., 2013), e.g., 2-back vs. 0-back; for the motor task, each movement vs. the average of all movements (11 maps). |
Conditions | All task conditions vs. baseline (31 maps). |
Contrasts | All contrasts between task conditions (16 maps). |
All-Setsdefault for set enrichment | All maps in 7 sets, one per task (WorkingMemory, Gambling, Motor, Language, Social, Relational, Emotion), for set enrichment. Unweighted. |
Show all 47 maps
MABaseline
The NiSpace "MABaseline" dataset contains meta-analytic "reporting baseline" maps as introduced with the C-SALE method (Magielse et al., 2025). Each map is the voxel-wise density of activation foci reported across a coordinate-based meta-analysis database or a subset of it, i.e., every focus convolved with an ALE kernel for a fixed sample size of n=20, then summed. Values are unnormalized. NiSpace uses these maps as sampling priors for coordinate-based (NiMARE) null maps, with null foci drawn with probability proportional to the map value; the relative voxel values therefore are the model and are not rescaled in any space. Fetch the original maps by requesting space="MNIOriginal" (downloaded unchanged from the source repository, https://github.com/CNG-LAB/cerebellum_specific_ALE). The processed maps are downloaded from the NiSpace-data GitHub repo; the original maps are on the MNI152NLin6Asym 2mm grid and were masked to the template brain mask, transformed to MNI152NLin2009cAsym with a pre-estimated MNI-to-MNI transformation, and to fsLR/fsaverage using neuromaps.

Coverage: Cortex + subcortex
Individual maps: 1
Precomputed for: AALCortical, AALSubcortical, Aseg, BrainnetomeCortical, BrainnetomeSubcortical, DesikanKilliany, DesikanKillianyTourville, Destrieux, Glasser, HarvardOxfordCortical, HarvardOxfordSubcortical, Schaefer1000Parcels17Networks, Schaefer1000Parcels7Networks, Schaefer100Parcels17Networks, Schaefer100Parcels7Networks, Schaefer200Parcels17Networks, Schaefer200Parcels7Networks, Schaefer400Parcels17Networks, Schaefer400Parcels7Networks, TianS1, TianS2, TianS3, TianS4, Yan100, Yan1000, Yan200, Yan400
Collections: 1 (see table below)
Metadata: metadata.csv
References: Magielse et al., 2025 · Yarkoni et al., 2011
License: ODbL 1.0
Show all 1 collections
| Collection | Content and use |
|---|---|
All | All meta-analytic reporting-baseline maps (currently the whole Neurosynth v7 database; Magielse et al., 2025). |
Show all 1 maps
| Map | Available spaces |
|---|---|
db-neurosynth_subset-all_pub-magielse2025 | MNI152NLin6Asym, MNI152NLin2009cAsym, fsLR, fsaverage |
MAGICC
The NiSpace "MAGICC" dataset contains cortical gene expression maps for > 10,000 genes based on a continuous reconstruction. The dataset consists of Allen Brain Atlas mRNA expression data from postmortem brain tissue of six donors (Hawrylycz et al., 2012), mapped onto continuous fsLR space as described in Wagstyl et al., 2024, and parcellated with integrated parcellation. Only genes that showed a high reproducibility (>= 0.5, see paper) were retained. Please cite the source publications, as well as publications associated with gene set collections as appropriate.
Coverage: Cortex only
Precomputed for: AALCortical, BrainnetomeCortical, DesikanKilliany, DesikanKillianyTourville, Destrieux, Glasser, HarvardOxfordCortical, Schaefer1000Parcels17Networks, Schaefer1000Parcels7Networks, Schaefer100Parcels17Networks, Schaefer100Parcels7Networks, Schaefer200Parcels17Networks, Schaefer200Parcels7Networks, Schaefer400Parcels17Networks, Schaefer400Parcels7Networks, Yan100, Yan1000, Yan200, Yan400
Collections: 22 (default CellTypesPsychEncodeTPM; see table below)
References: Hawrylycz et al., 2012 · Wagstyl et al., 2024
License: CC BY 4.0
Show all 22 collections
| Collection | Content and use |
|---|---|
All | All brain-expressed genes passing MAGICC reproducibility threshold (r ≥ 0.5). |
CellTypesPsychEncodeTPMdefault | Cell-type marker genes from PsychENCODE single-cell data (TPM-normalized). |
CellTypesPsychEncodeUMI | Cell-type marker genes from PsychENCODE single-cell data (UMI counts). |
CellTypesSilettiClusters | Cell-type cluster marker genes (Siletti et al., 2023 single-nucleus RNA-seq). |
CellTypesSilettiSuperclusters | Cell-type supercluster marker genes (Siletti et al., 2023). |
Chromosome | Genes grouped by chromosomal location (GSEA/MSigDB gene sets). |
SynGO | Synaptic gene ontology gene sets (SynGO database). |
GOBiologicalProcess | Gene Ontology biological process gene sets (GSEA/MSigDB). |
GOCellularComponent | Gene Ontology cellular component gene sets (GSEA/MSigDB). |
GOMolecularFunction | Gene Ontology molecular function gene sets (GSEA/MSigDB). |
CorticalLayers | Layer-enriched marker genes for cortical layers 1–6. |
ProteinAtlas | Human Protein Atlas RNA tissue specificity categories (HPA v25.1). Categories taken directly from HPA - ElevatedInBrain (in brain > other tissue), NotElevatedInBrain (deteced in brain but elevated elsewhere), LowSpecificityInBrain (broadly expressed, incl brain), NotInBrain (detected somewhere but not in brain), NotInTissue (not detected in any tissue). Combined categories for practical gene filtering - ExpressedInBrain (union of ElevatedInBrain, NotElevatedInBrain, LowSpecificityInBrain), NotExpressedInBrain (union of NotInBrain, NotInTissue). |
BrainSpan | Genes grouped by peak developmental expression stage (BrainSpan; ABAEnrichment). |
BrainSpanWeights | Gene-set scores per developmental expression stage weighted by log2-fold expression. |
ASDModulesGandal2022 | Gene co-expression modules significantly dysregulated in ASD cortex. Naming - GeneM3_up_cortex = gene module 3, significantly upregulated on cortex-level; GeneM4_down_region = gene module 4, significantly downregulated in at least one region. Modules have labels assigned in the source publication, or retroactively by us. GeneM9 ("neural noncoding") is excluded - almost all of its non-coding member genes are dropped by nispace's reproducibility-based gene filtering, so the remnant no longer represents the module. |
ASDModulesGandal2022Weights | Same gene sets as ASDModulesGandal2022, weighted by each gene's kME (module eigengene correlation / intramodular connectivity) to its own assigned module, so membership strength can be used as a continuous weight instead of binary in/out. |
FMR1Targets | FMR1/FMRP-related gene sets, 3 evidence types encoded in the set name - FMR1Target (CLIP-seq binding targets), ASDEditMod (RNA-editing co-module linked to ASD diagnosis), FXSEditDiff (differential RNA editing in Fragile-X-spectrum patients). FXSEditDiffHypo/FXSEditDiffHyper = FXSEditDiff genes whose sites are all edited less/more in Fragile X than in carriers/controls (genes with mixed-direction sites are only in FXSEditDiff). Naming - {EvidenceType}_{Context}_{Study}, e.g. FMR1Target_dNPC_Li2020. Note - NonNeuronal = HEK293 cells, MouseBrain = mouse not human; UCDavisFXTAS is premutation FXTAS, not full-mutation FXS. |
FXSEditDiffWeights | Same data as the six FXSEditDiff/FXSEditDiffHypo/FXSEditDiffHyper sets in FMR1Targets, weighted by the unsigned differential editing effect size (absolute difference of pooled editing levels, Fragile X vs. carriers/controls, 0-1 fraction scale; Tran et al. 2019 Supplementary Table 7), maximum over each gene's significant sites. Direction is encoded in the set name (Hypo/Hyper), so all weights are positive. |
GWASAtlas | MAGMA gene-based genome-wide-significant genes (p < 2.477e-6) for 17 psychiatric, neurological and neurodevelopmental disorders, computed by Watanabe et al., 2019 (GWAS ATLAS) from public GWAS summary statistics. Naming - {Disorder}_n{sample size}_{SourceStudy}, e.g. SCZ_n105318_Pardinas2018. 4 additional curated disorders (AlcoholDependence, AnxietyDisorder, FocalEpilepsy, PTSD) had zero genome-wide-significant genes and are not included here - see GWASAtlasWeights. |
GWASAtlasWeights | Same 21 disorders as GWASAtlas, including the 4 with zero genome-wide-significant genes, weighted by -log10(MAGMA gene-based p-value). This reflects statistical confidence in gene-disorder association, not a direct effect-size estimate - valid for thresholding uniformly across all disorders (recovering GWASAtlas is weight > 5.606), not for comparing raw weight magnitude between disorders of very different sample size. |
HPOAllPsychiatric | Genes annotated to 214 hand-curated Human Phenotype Ontology terms under "Abnormality of mental function", covering rare/monogenic disease-causing gene-phenotype annotations (OMIM/Orphanet case reports). "Psychiatric" is used in the DSM-5 nosological sense, covering neurodevelopmental, sleep-wake and neurocognitive/dementia terms alongside classic psychiatric diagnoses. 214 terms were manually selected. |
HPOCorePsychiatric | A subset of HPOAllPsychiatric's 214 terms that are actual diagnosis(-like) labels (e.g. Schizophrenia, Autism, Bipolar affective disorder) rather than granular symptom terms. |
MitoBrain
The NiSpace "MitoBrain" datasets contains mitochondrial phenotypes reconstructed from histological data. The source data is provided by MitoBrainMap (http://humanmitobrainmap.bcblab.com; Mosharov et al., 2025, Nature). Maps were generated by profiling OXPHOS enzyme activities and mitochondria density in a whole human hemisphere at 3mm voxel-like resolution and reconstruction into MNIs space. Original maps are retrieved from NeuroVault (https://identifiers.org/neurovault.collection:16418; space MNIOriginal), masked, resampled to 2mm MNI152NLin6Asym space, and transformed to MNI152NLin2009cAsym, fsLR, and fsaverage surface spaces.
Coverage: Cortex + subcortex
Individual maps: 6
Precomputed for: AALCortical, AALSubcortical, Aseg, BrainnetomeCortical, BrainnetomeSubcortical, DesikanKilliany, DesikanKillianyTourville, Destrieux, Glasser, HarvardOxfordCortical, HarvardOxfordSubcortical, Schaefer1000Parcels17Networks, Schaefer1000Parcels7Networks, Schaefer100Parcels17Networks, Schaefer100Parcels7Networks, Schaefer200Parcels17Networks, Schaefer200Parcels7Networks, Schaefer400Parcels17Networks, Schaefer400Parcels7Networks, TianS1, TianS2, TianS3, TianS4, Yan100, Yan1000, Yan200, Yan400
Collections: 1 (see table below)
Metadata: metadata.csv
References: Mosharov et al., 2025
License: CC0 1.0
Show all 1 collections
| Collection | Content and use |
|---|---|
All | Six brain-wide mitochondrial phenotype maps from the MitoBrainMap (Mosharov et al., 2025). |
Show all 6 maps
| Map | Available spaces |
|---|---|
feature-complexi_pub-mosharov2025 | MNI152NLin6Asym, MNI152NLin2009cAsym, fsLR, fsaverage |
feature-complexii_pub-mosharov2025 | MNI152NLin6Asym, MNI152NLin2009cAsym, fsLR, fsaverage |
feature-complexiv_pub-mosharov2025 | MNI152NLin6Asym, MNI152NLin2009cAsym, fsLR, fsaverage |
feature-mitodensity_pub-mosharov2025 | MNI152NLin6Asym, MNI152NLin2009cAsym, fsLR, fsaverage |
feature-mitoresp_pub-mosharov2025 | MNI152NLin6Asym, MNI152NLin2009cAsym, fsLR, fsaverage |
feature-tissueresp_pub-mosharov2025 | MNI152NLin6Asym, MNI152NLin2009cAsym, fsLR, fsaverage |
mRNA
The NiSpace "mRNA" dataset contains whole-brain gene expression maps for > 10,000 genes based on parcel-wise mapping. The dataset consists of Allen Brain Atlas mRNA expression data from postmortem brain tissue of six donors (Hawrylycz et al., 2012), mapped onto MNI or fsaverage parcels using the abagen toolbox (Markello et al., 2021; abagen.get_expression_data(..., lr_mirror="bidirectional", norm_matched=False)). Gene stability was assessed using a voxel-level atlas at 8mm isotropic resolution; genes were retained if their mean donor-to-donor Spearman rank correlation exceeded 0.2. Please cite the source publications, as well as publications associated with gene set collections as appropriate.
Coverage: Cortex + subcortex
Precomputed for: AALCortical, AALSubcortical, Aseg, BrainnetomeCortical, BrainnetomeSubcortical, DesikanKilliany, DesikanKillianyTourville, Destrieux, Glasser, HarvardOxfordCortical, HarvardOxfordSubcortical, Schaefer1000Parcels17Networks, Schaefer1000Parcels7Networks, Schaefer100Parcels17Networks, Schaefer100Parcels7Networks, Schaefer200Parcels17Networks, Schaefer200Parcels7Networks, Schaefer400Parcels17Networks, Schaefer400Parcels7Networks, TianS1, TianS2, TianS3, TianS4, Yan100, Yan1000, Yan200, Yan400
Collections: 22 (default CellTypesPsychEncodeTPM; see table below)
References: Hawrylycz et al., 2012 · Markello et al., 2021
License: Allen Institute Terms of Use
Show all 22 collections
| Collection | Content and use |
|---|---|
All | All brain-expressed genes passing stability threshold (donor-to-donor r > 0.2). |
CellTypesPsychEncodeTPMdefault | Cell-type marker genes from PsychENCODE single-cell data (TPM-normalized). |
CellTypesPsychEncodeUMI | Cell-type marker genes from PsychENCODE single-cell data (UMI counts). |
CellTypesSilettiClusters | Cell-type cluster marker genes (Siletti et al., 2023 single-nucleus RNA-seq). |
CellTypesSilettiSuperclusters | Cell-type supercluster marker genes (Siletti et al., 2023). |
Chromosome | Genes grouped by chromosomal location (GSEA/MSigDB gene sets). |
SynGO | Synaptic gene ontology gene sets (SynGO database). |
GOBiologicalProcess | Gene Ontology biological process gene sets (GSEA/MSigDB). |
GOCellularComponent | Gene Ontology cellular component gene sets (GSEA/MSigDB). |
GOMolecularFunction | Gene Ontology molecular function gene sets (GSEA/MSigDB). |
CorticalLayers | Layer-enriched marker genes for cortical layers 1–6. |
ProteinAtlas | Human Protein Atlas RNA tissue specificity categories (HPA v25.1). Categories taken directly from HPA - ElevatedInBrain (in brain > other tissue), NotElevatedInBrain (deteced in brain but elevated elsewhere), LowSpecificityInBrain (broadly expressed, incl brain), NotInBrain (detected somewhere but not in brain), NotInTissue (not detected in any tissue). Combined categories for practical gene filtering - ExpressedInBrain (union of ElevatedInBrain, NotElevatedInBrain, LowSpecificityInBrain), NotExpressedInBrain (union of NotInBrain, NotInTissue). |
BrainSpan | Genes grouped by peak developmental expression stage (BrainSpan; ABAEnrichment). |
BrainSpanWeights | Gene-set scores per developmental expression stage weighted by log2-fold expression. |
ASDModulesGandal2022 | Gene co-expression modules significantly dysregulated in ASD cortex. Naming - GeneM3_up_cortex = gene module 3, significantly upregulated on cortex-level; GeneM4_down_region = gene module 4, significantly downregulated in at least one region. Modules have labels assigned in the source publication, or retroactively by us. GeneM9 ("neural noncoding") is excluded - almost all of its non-coding member genes are dropped by nispace's reproducibility-based gene filtering, so the remnant no longer represents the module. |
ASDModulesGandal2022Weights | Same gene sets as ASDModulesGandal2022, weighted by each gene's kME (module eigengene correlation / intramodular connectivity) to its own assigned module, so membership strength can be used as a continuous weight instead of binary in/out. |
FMR1Targets | FMR1/FMRP-related gene sets, 3 evidence types encoded in the set name - FMR1Target (CLIP-seq binding targets), ASDEditMod (RNA-editing co-module linked to ASD diagnosis), FXSEditDiff (differential RNA editing in Fragile-X-spectrum patients). FXSEditDiffHypo/FXSEditDiffHyper = FXSEditDiff genes whose sites are all edited less/more in Fragile X than in carriers/controls (genes with mixed-direction sites are only in FXSEditDiff). Naming - {EvidenceType}_{Context}_{Study}, e.g. FMR1Target_dNPC_Li2020. Note - NonNeuronal = HEK293 cells, MouseBrain = mouse not human; UCDavisFXTAS is premutation FXTAS, not full-mutation FXS. |
FXSEditDiffWeights | Same data as the six FXSEditDiff/FXSEditDiffHypo/FXSEditDiffHyper sets in FMR1Targets, weighted by the unsigned differential editing effect size (absolute difference of pooled editing levels, Fragile X vs. carriers/controls, 0-1 fraction scale; Tran et al. 2019 Supplementary Table 7), maximum over each gene's significant sites. Direction is encoded in the set name (Hypo/Hyper), so all weights are positive. |
GWASAtlas | MAGMA gene-based genome-wide-significant genes (p < 2.477e-6) for 17 psychiatric, neurological and neurodevelopmental disorders, computed by Watanabe et al., 2019 (GWAS ATLAS) from public GWAS summary statistics. Naming - {Disorder}_n{sample size}_{SourceStudy}, e.g. SCZ_n105318_Pardinas2018. 4 additional curated disorders (AlcoholDependence, AnxietyDisorder, FocalEpilepsy, PTSD) had zero genome-wide-significant genes and are not included here - see GWASAtlasWeights. |
GWASAtlasWeights | Same 21 disorders as GWASAtlas, including the 4 with zero genome-wide-significant genes, weighted by -log10(MAGMA gene-based p-value). This reflects statistical confidence in gene-disorder association, not a direct effect-size estimate - valid for thresholding uniformly across all disorders (recovering GWASAtlas is weight > 5.606), not for comparing raw weight magnitude between disorders of very different sample size. |
HPOAllPsychiatric | Genes annotated to 214 hand-curated Human Phenotype Ontology terms under "Abnormality of mental function", covering rare/monogenic disease-causing gene-phenotype annotations (OMIM/Orphanet case reports). "Psychiatric" is used in the DSM-5 nosological sense, covering neurodevelopmental, sleep-wake and neurocognitive/dementia terms alongside classic psychiatric diagnoses. 214 terms were manually selected. |
HPOCorePsychiatric | A subset of HPOAllPsychiatric's 214 terms that are actual diagnosis(-like) labels (e.g. Schizophrenia, Autism, Bipolar affective disorder) rather than granular symptom terms. |
Neurosynth
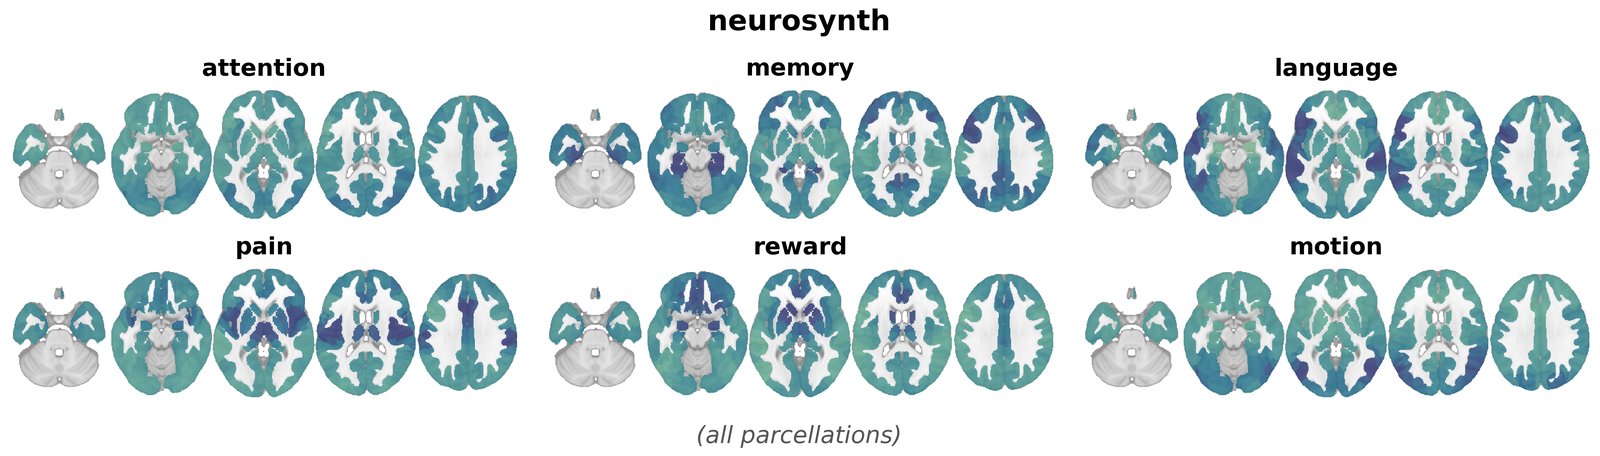
The NiSpace "Neurosynth" dataset contains > 1,000 meta-analytic maps for terms from the Neurosynth database. For each Neurosynth term (https://neurosynth.org/) of interest for spatial correlation analysis, a "MKDAChi2" meta-analysis map was generated in MNI152NLin6Asym-2mm space using the nimare package. The resulting "z_desc-association" maps are available only as parcellation tables.
Coverage: Cortex + subcortex
Precomputed for: AALCortical, AALSubcortical, Aseg, BrainnetomeCortical, BrainnetomeSubcortical, DesikanKilliany, DesikanKillianyTourville, Destrieux, Glasser, HarvardOxfordCortical, HarvardOxfordSubcortical, Schaefer1000Parcels17Networks, Schaefer1000Parcels7Networks, Schaefer100Parcels17Networks, Schaefer100Parcels7Networks, Schaefer200Parcels17Networks, Schaefer200Parcels7Networks, Schaefer400Parcels17Networks, Schaefer400Parcels7Networks, TianS1, TianS2, TianS3, TianS4, Yan100, Yan1000, Yan200, Yan400
Collections: 2 (default CognitiveFunctions; see table below)
References: Yarkoni et al., 2011 · Salo et al., 2022 · Wager et al., 2007
License: ODbL 1.0
Show all 2 collections
| Collection | Content and use |
|---|---|
All | All curated Neurosynth term-based meta-analytic maps (z-scores, association test). |
CognitiveFunctionsdefault | Subset of terms sorted manually into broad cognitive function domains. |
PET
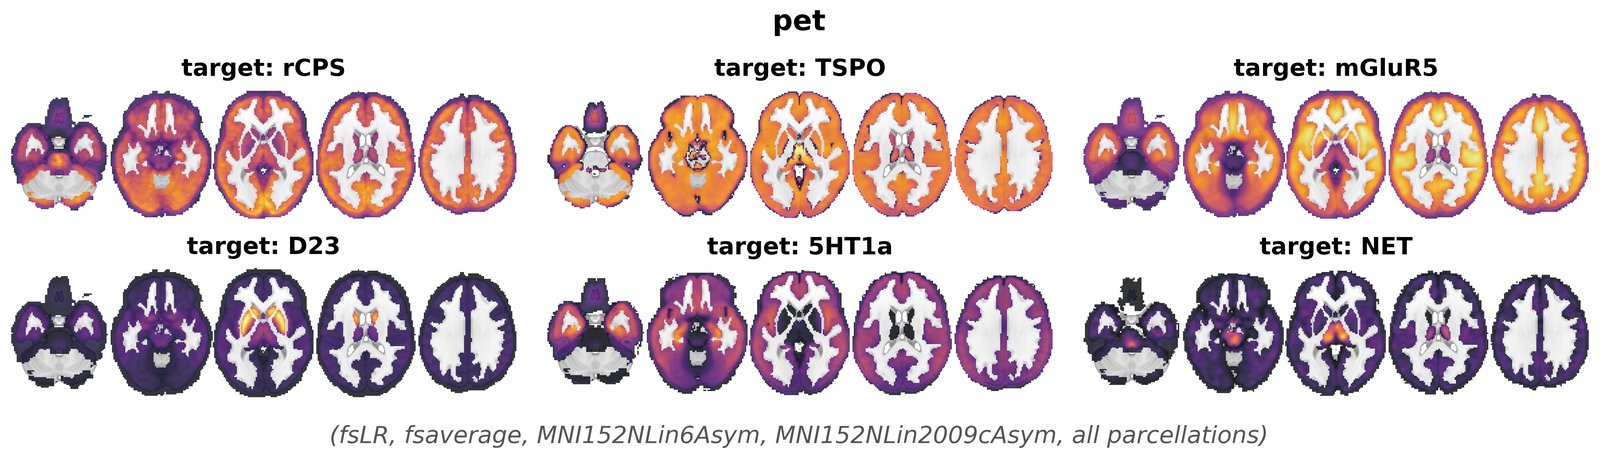
The NiSpace "PET" dataset contains a growing collection of nuclear imaging maps from different source publications. Most maps were originally accessed via neuromaps (https://neuromaps-main.readthedocs.io/) and can be downloaded directly via neuromaps using the "original" spaces "MNIOriginal", "fsaverageOriginal", or "fsLROriginal". Maps requested in a defined space ("MNI152NLin2009cAsym", "MNI152NLin6Asym", "fsaverage", or "fsLR") are sourced from the NiSpace-data GitHub repo. These maps were directly registered to 2mm MNI152NLin6Asym space, and transformed to 2mm MNI152NLin2009cAsym with a pre-estimated MNI-to-MNI transformation using SynthMorph v4. The resulting maps were masked with a liberal grey matter mask generated from the Harvard-Oxford atlas and scaled from 1e-6 to 1. The accompanying metadata table contains detailed information about tracers, source samples, original publications and data sources, as well as the publication licenses. Every map should be cited when used. The responsibility for this lies with the user!
Coverage: Cortex + subcortex
Individual maps: 49
Precomputed for: AALCortical, AALSubcortical, Aseg, BrainnetomeCortical, BrainnetomeSubcortical, DesikanKilliany, DesikanKillianyTourville, Destrieux, Glasser, HarvardOxfordCortical, HarvardOxfordSubcortical, Schaefer1000Parcels17Networks, Schaefer1000Parcels7Networks, Schaefer100Parcels17Networks, Schaefer100Parcels7Networks, Schaefer200Parcels17Networks, Schaefer200Parcels7Networks, Schaefer400Parcels17Networks, Schaefer400Parcels7Networks, TianS1, TianS2, TianS3, TianS4, Yan100, Yan1000, Yan200, Yan400
Collections: 9 (default UniqueTracers, set enrichment UniqueTracers; see table below)
Metadata: metadata.csv
References: Markello et al., 2022 · Hansen et al., 2022 · Dukart et al., 2021 · Hoffmann et al., 2024
License: CC BY-NC-SA 4.0 (40 maps), CC0 1.0 (5 maps), free (2 maps), CC BY 4.0 (1 map), MIT (1 map)
Show all 9 collections
| Collection | Content and use |
|---|---|
All | All PET receptor/transporter density maps. |
OnePerTarget | One map per molecular target (29 maps), without sets; the same maps as the legacy UniqueTracers. Selection order - maps processed in volume space over fsaverage-processed ones, tracer suitability, sample size - with exceptions - Savli et al. 2012 maps for homogeneity across serotonin targets; [11C]FLB457 for D2/3 (strongest cortical signal; striatal values compressed); [11C]MRB from Hesse et al. 2017 for NET. For per-target sets, use fetch_reference(..., set_by="target"). |
OnePerTracer | One map per molecular target and tracer (37 maps), without sets - OnePerTarget plus the largest-sample map of every further tracer, preferring maps processed in volume space. Includes fsaverage-processed maps where no other map of that tracer exists (see the map notes). |
OnePerTarget-Sets | OnePerTarget maps in 13 overlapping sets for set enrichment - transmitter systems (Dopamine, Serotonin, Noradrenaline, Monoamines, Acetylcholine, Glutamate, GABA, Opioids), target classes (Transporters, Ionotropic receptors, Metabotropic receptors), Neuroinflammation, and Synapse/Metabolism. Maps can belong to several sets (e.g., VMAT2), so use it for set enrichment, not plain colocalization. Unweighted. |
OnePerTracer-Sets | OnePerTracer maps in the same 13 overlapping sets as OnePerTarget-Sets, for set enrichment. Weighted - each map's weight is 1 divided by the number of the same target's maps in that set, so every target counts once. |
All-Sets | All maps in the same 13 overlapping sets as OnePerTarget-Sets, for set enrichment. Weighted like OnePerTracer-Sets, so every target counts once. |
AllTargetSets | Legacy, to be removed at the first non-dev release - all maps grouped by molecular target, weighted by sample size. Use fetch_reference(..., set_by="target") instead. |
UniqueTracersdefault, default for set enrichment | Legacy, to be removed at the first non-dev release - one map per molecular target in 9 system sets. Use OnePerTarget or OnePerTarget-Sets instead. |
UniqueTracerSets | Legacy, to be removed at the first non-dev release - all maps of the UniqueTracers tracers (replicates included), grouped by molecular target and weighted by sample size. Use OnePerTracer or fetch_reference(..., set_by="target") instead. |
Show all 49 maps
| Map | Available spaces |
|---|---|
target-5HT1a_tracer-cumi101_n-8_dx-hc_pub-beliveau2017 | fsaverage, fsLR, MNI152NLin6Asym, MNI152NLin2009cAsym |
target-5HT1a_tracer-way100635_n-35_dx-hc_pub-savli2012 | MNI152NLin6Asym, MNI152NLin2009cAsym, fsaverage, fsLR |
target-5HT1b_tracer-az10419369_n-36_dx-hc_pub-beliveau2017 | fsaverage, fsLR, MNI152NLin6Asym, MNI152NLin2009cAsym |
target-5HT1b_tracer-p943_n-23_dx-hc_pub-savli2012 | MNI152NLin6Asym, MNI152NLin2009cAsym, fsaverage, fsLR |
target-5HT1b_tracer-p943_n-65_dx-hc_pub-gallezot2010 | MNI152NLin6Asym, MNI152NLin2009cAsym, fsaverage, fsLR |
target-5HT2a_tracer-altanserin_n-19_dx-hc_pub-savli2012 | MNI152NLin6Asym, MNI152NLin2009cAsym, fsaverage, fsLR |
target-5HT2a_tracer-cimbi36_n-29_dx-hc_pub-beliveau2017 | fsaverage, fsLR, MNI152NLin6Asym, MNI152NLin2009cAsym |
target-5HT4_tracer-sb207145_n-59_dx-hc_pub-beliveau2017 | fsaverage, fsLR, MNI152NLin6Asym, MNI152NLin2009cAsym |
target-5HT6_tracer-gsk215083_n-30_dx-hc_pub-radhakrishnan2018 | MNI152NLin6Asym, MNI152NLin2009cAsym, fsaverage, fsLR |
target-5HTT_tracer-dasb_n-100_dx-hc_pub-beliveau2017 | fsaverage, fsLR, MNI152NLin6Asym, MNI152NLin2009cAsym |
target-5HTT_tracer-dasb_n-18_dx-hc_pub-savli2012 | MNI152NLin6Asym, MNI152NLin2009cAsym, fsaverage, fsLR |
target-5HTT_tracer-madam_n-10_dx-hc_pub-fazio2016 | MNI152NLin6Asym, MNI152NLin2009cAsym, fsaverage, fsLR |
target-A4B2_tracer-flubatine_n-30_dx-hc_pub-hillmer2016 | MNI152NLin6Asym, MNI152NLin2009cAsym, fsaverage, fsLR |
target-CB1_tracer-fmpepd2_n-22_dx-hc_pub-laurikainen2019 | MNI152NLin6Asym, MNI152NLin2009cAsym, fsaverage, fsLR |
target-CB1_tracer-omar_n-77_dx-hc_pub-normandin2015 | MNI152NLin6Asym, MNI152NLin2009cAsym, fsaverage, fsLR |
target-CMRglu_tracer-fdg_n-20_dx-hc_pub-castrillon2023 | MNI152NLin6Asym, MNI152NLin2009cAsym, fsaverage, fsLR |
target-COX1_tracer-ps13_n-11_dx-hc_pub-kim2020 | MNI152NLin6Asym, MNI152NLin2009cAsym, fsaverage, fsLR |
target-D1_tracer-sch23390_n-13_dx-hc_pub-kaller2017 | MNI152NLin6Asym, MNI152NLin2009cAsym, fsaverage, fsLR |
target-D23_tracer-fallypride_n-49_dx-hc_pub-jaworska2020 | MNI152NLin6Asym, MNI152NLin2009cAsym, fsaverage, fsLR |
target-D23_tracer-flb457_n-37_dx-hc_pub-smith2017 | MNI152NLin6Asym, MNI152NLin2009cAsym, fsaverage, fsLR |
target-D23_tracer-flb457_n-55_dx-hc_pub-sandiego2015 | MNI152NLin6Asym, MNI152NLin2009cAsym, fsaverage, fsLR |
target-D23_tracer-raclopride_n-156_dx-hc_pub-malen2022 | MNI152NLin6Asym, MNI152NLin2009cAsym, fsaverage, fsLR |
target-D23_tracer-raclopride_n-7_dx-hc_pub-alarkurtti2015 | MNI152NLin6Asym, MNI152NLin2009cAsym, fsaverage, fsLR |
target-DAT_tracer-fepe2i_n-6_dx-hc_pub-sasaki2012 | MNI152NLin6Asym, MNI152NLin2009cAsym, fsaverage, fsLR |
target-DAT_tracer-fpcit_n-174_dx-hc_pub-dukart2018 | MNI152NLin6Asym, MNI152NLin2009cAsym, fsaverage, fsLR |
target-DAT_tracer-fpcit_n-30_dx-hc_pub-garciagomez2013 | MNI152NLin6Asym, MNI152NLin2009cAsym, fsaverage, fsLR |
target-FDOPA_tracer-fluorodopa_n-12_dx-hc_pub-garciagomez2018 | MNI152NLin6Asym, MNI152NLin2009cAsym, fsaverage, fsLR |
target-GABAa5_tracer-ro154513_n-10_dx-hc_pub-lukow2022 | MNI152NLin6Asym, MNI152NLin2009cAsym, fsaverage, fsLR |
target-GABAa_tracer-flumazenil_n-16_dx-hc_pub-norgaard2021 | fsaverage, fsLR, MNI152NLin6Asym, MNI152NLin2009cAsym |
target-GABAa_tracer-flumazenil_n-6_dx-hc_pub-dukart2018 | MNI152NLin6Asym, MNI152NLin2009cAsym, fsaverage, fsLR |
target-H3_tracer-gsk189254_n-8_dx-hc_pub-gallezot2017 | MNI152NLin6Asym, MNI152NLin2009cAsym, fsaverage, fsLR |
target-HDAC_tracer-martinostat_n-8_dx-hc_pub-wey2016 | MNI152NLin6Asym, MNI152NLin2009cAsym, fsaverage, fsLR |
target-KOR_tracer-ly2795050_n-28_dx-hc_pub-vijay2018 | MNI152NLin6Asym, MNI152NLin2009cAsym, fsaverage, fsLR |
target-M1_tracer-lsn3172176_n-24_dx-hc_pub-naganawa2020 | MNI152NLin6Asym, MNI152NLin2009cAsym, fsaverage, fsLR |
target-MOR_tracer-carfentanil_n-204_dx-hc_pub-kantonen2020 | MNI152NLin6Asym, MNI152NLin2009cAsym, fsaverage, fsLR |
target-MOR_tracer-carfentanil_n-39_dx-hc_pub-turtonen2021 | MNI152NLin6Asym, MNI152NLin2009cAsym, fsaverage, fsLR |
target-NET_tracer-mrb_n-10_dx-hc_pub-hesse2017 | MNI152NLin6Asym, MNI152NLin2009cAsym, fsaverage, fsLR |
target-NET_tracer-mrb_n-77_dx-hc_pub-ding2010 | MNI152NLin6Asym, MNI152NLin2009cAsym, fsaverage, fsLR |
target-NMDA_tracer-ge179_n-29_dx-hc_pub-galovic2021 | MNI152NLin6Asym, MNI152NLin2009cAsym, fsaverage, fsLR |
target-SV2A_tracer-ucbj_n-76_dx-hc_pub-finnema2016 | MNI152NLin6Asym, MNI152NLin2009cAsym, fsaverage, fsLR |
target-TSPO_tracer-pbr28_n-6_dx-hc_pub-lois2018 | MNI152NLin6Asym, MNI152NLin2009cAsym, fsaverage, fsLR |
target-VAChT_tracer-feobv_n-18_dx-hc_pub-aghourian2017 | MNI152NLin6Asym, MNI152NLin2009cAsym, fsaverage, fsLR |
target-VAChT_tracer-feobv_n-4_dx-hc_pub-tuominen | MNI152NLin6Asym, MNI152NLin2009cAsym, fsaverage, fsLR |
target-VAChT_tracer-feobv_n-5_dx-hc_pub-bedard2019 | MNI152NLin6Asym, MNI152NLin2009cAsym, fsaverage, fsLR |
target-VMAT2_tracer-dtbz_n-76_dx-hc_pub-larsen2020 | MNI152NLin6Asym, MNI152NLin2009cAsym, fsaverage, fsLR |
target-mGluR5_tracer-abp688_n-22_dx-hc_pub-rosaneto | MNI152NLin6Asym, MNI152NLin2009cAsym, fsaverage, fsLR |
target-mGluR5_tracer-abp688_n-28_dx-hc_pub-dubois2015 | MNI152NLin6Asym, MNI152NLin2009cAsym, fsaverage, fsLR |
target-mGluR5_tracer-abp688_n-73_dx-hc_pub-smart2019 | MNI152NLin6Asym, MNI152NLin2009cAsym, fsaverage, fsLR |
target-rCPS_tracer-leucine_n-42_dx-hc_pub-smith2023 | MNI152NLin6Asym, MNI152NLin2009cAsym, fsaverage, fsLR |
RSN
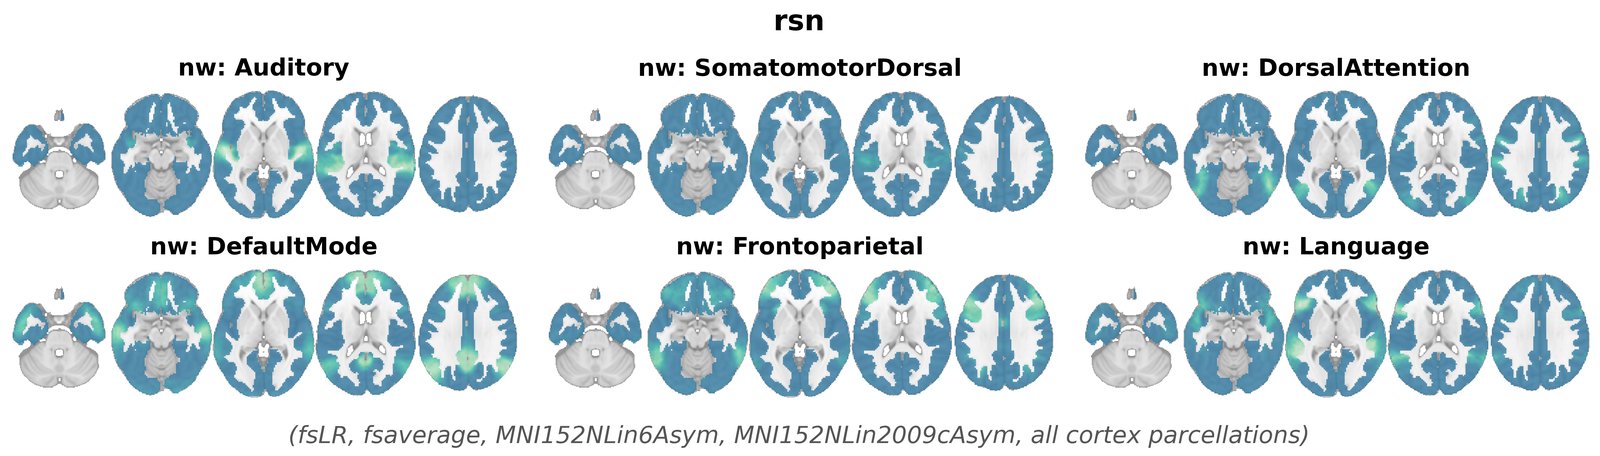
The NiSpace "RSN" dataset is based on resting-state network probability maps generated by Dworetsky et al., 2021. The maps were obtained from the associated GitHub repository and can be retrieved in their original form with space="MNIOriginal". The original maps are in WashU 711-2B (Talairach) atlas space and were treated as MNI152NLin6Asym space without a transformation (resampled to 2mm), then transformed to MNI152NLin2009cAsym with a pre-estimated MNI-to-MNI transformation, divided by 100, masked with a liberal grey matter mask, and transformed to fsLR and fsaverage. Please cite the original publication when using these maps.
Coverage: Cortex only
Individual maps: 14
Precomputed for: AALCortical, BrainnetomeCortical, DesikanKilliany, DesikanKillianyTourville, Destrieux, Glasser, HarvardOxfordCortical, Schaefer1000Parcels17Networks, Schaefer1000Parcels7Networks, Schaefer100Parcels17Networks, Schaefer100Parcels7Networks, Schaefer200Parcels17Networks, Schaefer200Parcels7Networks, Schaefer400Parcels17Networks, Schaefer400Parcels7Networks, Yan100, Yan1000, Yan200, Yan400
Collections: 1 (see table below)
References: Dworetsky et al., 2021
License: GPL 3.0
Show all 1 collections
| Collection | Content and use |
|---|---|
All | All 17 resting-state network maps (Dworetsky et al., 2021). |
Show all 14 maps
| Map | Available spaces |
|---|---|
nw-Auditory_pub-dworetsky2021 | MNI152NLin6Asym, MNI152NLin2009cAsym, fsaverage, fsLR |
nw-Cinguloopercular_pub-dworetsky2021 | MNI152NLin6Asym, MNI152NLin2009cAsym, fsaverage, fsLR |
nw-DefaultMode_pub-dworetsky2021 | MNI152NLin6Asym, MNI152NLin2009cAsym, fsaverage, fsLR |
nw-DorsalAttention_pub-dworetsky2021 | MNI152NLin6Asym, MNI152NLin2009cAsym, fsaverage, fsLR |
nw-Frontoparietal_pub-dworetsky2021 | MNI152NLin6Asym, MNI152NLin2009cAsym, fsaverage, fsLR |
nw-Language_pub-dworetsky2021 | MNI152NLin6Asym, MNI152NLin2009cAsym, fsaverage, fsLR |
nw-MedialTemporal_pub-dworetsky2021 | MNI152NLin6Asym, MNI152NLin2009cAsym, fsaverage, fsLR |
nw-Parietomedial_pub-dworetsky2021 | MNI152NLin6Asym, MNI152NLin2009cAsym, fsaverage, fsLR |
nw-Parietooccipital_pub-dworetsky2021 | MNI152NLin6Asym, MNI152NLin2009cAsym, fsaverage, fsLR |
nw-Salience_pub-dworetsky2021 | MNI152NLin6Asym, MNI152NLin2009cAsym, fsaverage, fsLR |
nw-SomatomotorDorsal_pub-dworetsky2021 | MNI152NLin6Asym, MNI152NLin2009cAsym, fsaverage, fsLR |
nw-SomatomotorLateral_pub-dworetsky2021 | MNI152NLin6Asym, MNI152NLin2009cAsym, fsaverage, fsLR |
nw-TemporalPole_pub-dworetsky2021 | MNI152NLin6Asym, MNI152NLin2009cAsym, fsaverage, fsLR |
nw-Visual_pub-dworetsky2021 | MNI152NLin6Asym, MNI152NLin2009cAsym, fsaverage, fsLR |
RSN17
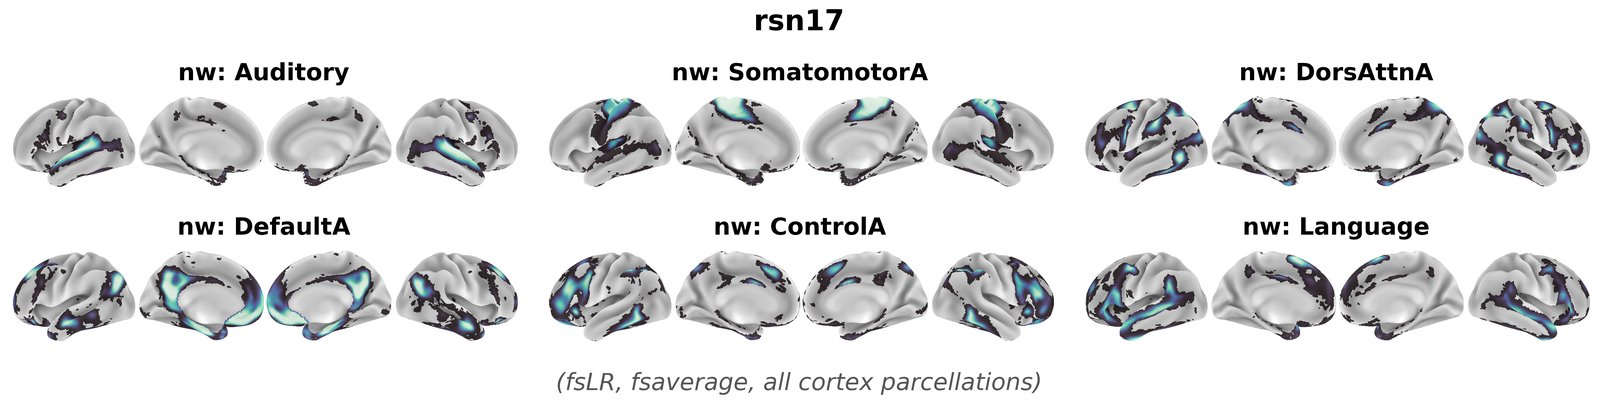
The NiSpace "RSN17" dataset contains resting-state network probability maps describing the 17 "Kong" networks. The maps were derived from individual-level cortical parcellations of 1029 HCP subjects into 17 functional networks, generated as described in Kong et al., 2021 and made available at https://github.com/ThomasYeoLab/Kong2022_ArealMSHBM. The maps are only available in fsLR and fsaverage spaces. Note that the networks follow the Kong et al. naming convention, which differs from the 17 "Yeo networks". Please cite the original publication when using these maps.
Coverage: Cortex only
Individual maps: 17
Precomputed for: AALCortical, BrainnetomeCortical, DesikanKilliany, DesikanKillianyTourville, Destrieux, Glasser, HarvardOxfordCortical, Schaefer1000Parcels17Networks, Schaefer1000Parcels7Networks, Schaefer100Parcels17Networks, Schaefer100Parcels7Networks, Schaefer200Parcels17Networks, Schaefer200Parcels7Networks, Schaefer400Parcels17Networks, Schaefer400Parcels7Networks, Yan100, Yan1000, Yan200, Yan400
Collections: 1 (see table below)
References: Kong et al., 2021
License: GPL 2.0
Show all 1 collections
| Collection | Content and use |
|---|---|
All | All 17 Kong2022 MSHBM resting-state network maps (Kong et al., 2022). |
Show all 17 maps
| Map | Available spaces |
|---|---|
nw-Auditory_pub-kong2022 | fsaverage, fsLR |
nw-ControlA_pub-kong2022 | fsaverage, fsLR |
nw-ControlB_pub-kong2022 | fsaverage, fsLR |
nw-ControlC_pub-kong2022 | fsaverage, fsLR |
nw-DefaultA_pub-kong2022 | fsaverage, fsLR |
nw-DefaultB_pub-kong2022 | fsaverage, fsLR |
nw-DefaultC_pub-kong2022 | fsaverage, fsLR |
nw-DorsAttnA_pub-kong2022 | fsaverage, fsLR |
nw-DorsAttnB_pub-kong2022 | fsaverage, fsLR |
nw-Language_pub-kong2022 | fsaverage, fsLR |
nw-SalVenAttnA_pub-kong2022 | fsaverage, fsLR |
nw-SalVenAttnB_pub-kong2022 | fsaverage, fsLR |
nw-SomatomotorA_pub-kong2022 | fsaverage, fsLR |
nw-SomatomotorB_pub-kong2022 | fsaverage, fsLR |
nw-VisualA_pub-kong2022 | fsaverage, fsLR |
nw-VisualB_pub-kong2022 | fsaverage, fsLR |
nw-VisualC_pub-kong2022 | fsaverage, fsLR |
TPM
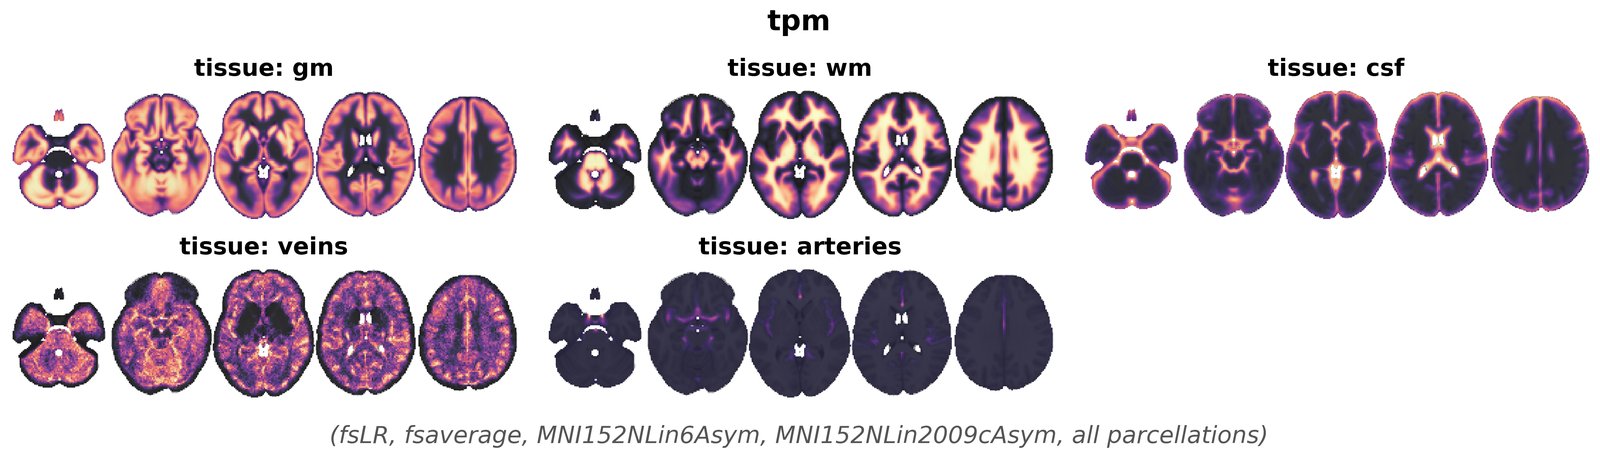
The NiSpace "TPM" dataset is based on openly available tissue probability maps collected from different sources. Many of these maps were used in Bolt et al., 2025. Fetch the original maps by requesting space="MNIOriginal". The processed maps are downloaded from the NiSpace-data GitHub repo. The SPM tissue probability maps (gm, wm, csf) are in SPM-TPM space (SPM12 tpm/TPM.nii) and were transformed to MNI152NLin6Asym and MNI152NLin2009cAsym with pre-estimated MNI-to-MNI transformations; the vessel maps (veins, arteries) were downloaded in MNI152NLin6Asym space and transformed to MNI152NLin2009cAsym with a pre-estimated MNI-to-MNI transformation. All maps were transformed from MNI152NLin6Asym to fsLR/fsaverage using neuromaps. Please cite the appropriate original publication for each map when used (see map info table).
Coverage: Cortex + subcortex
Individual maps: 5
Precomputed for: AALCortical, AALSubcortical, Aseg, BrainnetomeCortical, BrainnetomeSubcortical, DesikanKilliany, DesikanKillianyTourville, Destrieux, Glasser, HarvardOxfordCortical, HarvardOxfordSubcortical, Schaefer1000Parcels17Networks, Schaefer1000Parcels7Networks, Schaefer100Parcels17Networks, Schaefer100Parcels7Networks, Schaefer200Parcels17Networks, Schaefer200Parcels7Networks, Schaefer400Parcels17Networks, Schaefer400Parcels7Networks, TianS1, TianS2, TianS3, TianS4, Yan100, Yan1000, Yan200, Yan400
Collections: 1 (see table below)
Metadata: metadata.csv
References: Bolt et al., 2025
License: GPL 2.0 (2 maps), free (1 map), CC0 1.0 (1 map), CC BY 4.0 (1 map)
Show all 1 collections
| Collection | Content and use |
|---|---|
All | Gray matter, white matter, and CSF tissue probability maps (SPM TPM). |
Show all 5 maps
| Map | Available spaces |
|---|---|
tissue-arteries_pub-mouches2019 | fsaverage, fsLR, MNI152NLin6Asym, MNI152NLin2009cAsym |
tissue-csf_pub-spm | fsaverage, fsLR, MNI152NLin6Asym, MNI152NLin2009cAsym |
tissue-gm_pub-spm | fsaverage, fsLR, MNI152NLin6Asym, MNI152NLin2009cAsym |
tissue-veins_pub-huck2019 | fsaverage, fsLR, MNI152NLin6Asym, MNI152NLin2009cAsym |
tissue-wm_pub-spm | fsaverage, fsLR, MNI152NLin6Asym, MNI152NLin2009cAsym |