Exploring the neurobiological correlates of ENIGMA cortical thickness maps#
[1]:
# general imports
import numpy as np
import pandas as pd
import matplotlib.pyplot as plt
[2]:
# load local nispace, for testing
# COMMENT THIS OUT IF YOU RUN THIS LOCALLY AFTER INSTALLING NISPACE
import sys
sys.path.append("/Users/llotter/projects/nispace/")
Fetch the ENIGMA example dataset#
[3]:
from nispace.datasets import fetch_example


# ENIGMA data is only available in the DesikanKilliany parcellation
parc_name = "DesikanKilliany"

# get data
enigma_data = fetch_example("enigma", parc_name)
display(enigma_data.shape, enigma_data)
INFO | 15/06/25 16:40:45 | nispace: Loading example dataset: 'enigma', parcellated with: DesikanKilliany.
(13, 68)
| L_bankssts | L_caudalanteriorcingulate | L_caudalmiddlefrontal | L_cuneus | L_entorhinal | L_fusiform | L_inferiorparietal | L_inferiortemporal | L_isthmuscingulate | L_lateraloccipital | ... | R_rostralanteriorcingulate | R_rostralmiddlefrontal | R_superiorfrontal | R_superiorparietal | R_superiortemporal | R_supramarginal | R_frontalpole | R_temporalpole | R_transversetemporal | R_insula | |
|---|---|---|---|---|---|---|---|---|---|---|---|---|---|---|---|---|---|---|---|---|---|
| MDD | -0.058 | -0.042 | -0.014 | 0.047 | -0.041 | -0.117 | -0.063 | -0.049 | -0.104 | -0.023 | ... | -0.098 | -0.038 | -0.078 | 0.032 | -0.031 | -0.053 | -0.062 | 0.013 | -0.051 | -0.115 |
| PTSD | -0.100 | -0.100 | -0.120 | -0.070 | 0.050 | -0.060 | -0.140 | -0.070 | -0.020 | -0.150 | ... | 0.010 | -0.100 | -0.120 | -0.120 | -0.140 | -0.150 | -0.100 | -0.020 | -0.050 | -0.110 |
| AN | -0.738 | -0.065 | -0.760 | -0.663 | 0.060 | -0.538 | -0.895 | -0.537 | -0.620 | -0.747 | ... | -0.003 | -0.507 | -0.722 | -0.925 | -0.522 | -0.756 | -0.332 | -0.055 | -0.258 | -0.339 |
| ADHD | 0.000 | -0.040 | -0.050 | 0.020 | -0.080 | -0.100 | 0.010 | -0.030 | 0.030 | 0.030 | ... | -0.010 | 0.000 | 0.000 | 0.010 | 0.000 | -0.020 | 0.010 | -0.120 | 0.010 | -0.050 |
| ASD | 0.000 | 0.020 | 0.050 | 0.060 | -0.150 | NaN | 0.010 | -0.050 | 0.020 | -0.010 | ... | 0.090 | 0.220 | 0.200 | -0.040 | -0.050 | -0.080 | 0.090 | -0.150 | -0.130 | -0.100 |
| OCD | -0.060 | 0.003 | -0.090 | -0.042 | -0.062 | -0.109 | -0.140 | -0.087 | -0.068 | -0.074 | ... | 0.005 | -0.091 | -0.038 | -0.047 | 0.014 | 0.003 | 0.021 | 0.015 | -0.024 | -0.065 |
| BD | -0.207 | -0.095 | -0.266 | -0.056 | -0.036 | -0.288 | -0.265 | -0.250 | -0.132 | -0.156 | ... | -0.087 | -0.264 | -0.256 | -0.158 | -0.194 | -0.184 | -0.102 | -0.059 | -0.109 | -0.168 |
| SCZ | -0.352 | -0.119 | -0.363 | -0.203 | -0.203 | -0.491 | -0.362 | -0.449 | -0.309 | -0.331 | ... | -0.120 | -0.313 | -0.397 | -0.219 | -0.438 | -0.386 | -0.207 | -0.236 | -0.262 | -0.406 |
| 22q11.2 | -0.030 | -0.210 | 0.510 | 0.520 | 0.160 | 0.190 | 0.250 | 0.280 | 0.300 | 0.220 | ... | 0.160 | 0.800 | 0.530 | 0.300 | -0.320 | 0.710 | 0.140 | 0.010 | 0.060 | 0.630 |
| Epilepsy - all | -0.092 | 0.039 | -0.319 | -0.157 | -0.264 | -0.187 | -0.197 | -0.085 | -0.049 | -0.190 | ... | 0.093 | -0.197 | -0.269 | -0.313 | -0.123 | -0.223 | -0.109 | -0.181 | -0.182 | -0.022 |
| Epilepsy - temporal | -0.077 | 0.087 | -0.202 | -0.091 | -0.188 | -0.108 | -0.127 | -0.038 | 0.004 | -0.126 | ... | -0.026 | -0.046 | -0.100 | -0.134 | 0.042 | -0.071 | 0.039 | -0.276 | -0.072 | -0.030 |
| Epilepsy - generalized | -0.100 | 0.181 | -0.403 | -0.190 | -0.445 | -0.359 | -0.242 | -0.207 | -0.021 | -0.311 | ... | 0.200 | -0.242 | -0.365 | -0.474 | -0.165 | -0.303 | -0.100 | -0.033 | -0.161 | 0.069 |
| PD | -0.104 | 0.043 | -0.135 | -0.112 | -0.096 | -0.198 | -0.188 | -0.193 | -0.177 | -0.166 | ... | -0.010 | -0.047 | -0.110 | -0.174 | -0.077 | -0.153 | -0.094 | -0.096 | -0.068 | -0.077 |
13 rows × 68 columns
Fetch reference data#
[4]:
from nispace.datasets import fetch_reference

ref_data = fetch_reference("neurosynth", collection="CognitiveFunctions", parcellation=parc_name,
                           print_references=False)
ref_data_maps_pet_set = ref_data.index.get_level_values("set").value_counts(sort=False)

display(ref_data.shape, ref_data.head(5))
print(f"Between {ref_data_maps_pet_set.min()} and {ref_data_maps_pet_set.max()} maps per set")

# ref_data = mean_by_set_df(ref_data)
display(ref_data.shape, ref_data.head(5))
INFO | 15/06/25 16:40:45 | nispace: Loading neurosynth maps.
INFO | 15/06/25 16:40:45 | nispace: Applying collection filter from: /Users/llotter/nispace-data/reference/neurosynth/collection-CognitiveFunctions.collect.
INFO | 15/06/25 16:40:45 | nispace: Loading data parcellated with 'DesikanKilliany'
(101, 68)
| hemi-L_lab-bankssts | hemi-L_lab-caudalanteriorcingulate | hemi-L_lab-caudalmiddlefrontal | hemi-L_lab-cuneus | hemi-L_lab-entorhinal | hemi-L_lab-fusiform | hemi-L_lab-inferiorparietal | hemi-L_lab-inferiortemporal | hemi-L_lab-isthmuscingulate | hemi-L_lab-lateraloccipital | ... | hemi-R_lab-rostralanteriorcingulate | hemi-R_lab-rostralmiddlefrontal | hemi-R_lab-superiorfrontal | hemi-R_lab-superiorparietal | hemi-R_lab-superiortemporal | hemi-R_lab-supramarginal | hemi-R_lab-frontalpole | hemi-R_lab-temporalpole | hemi-R_lab-transversetemporal | hemi-R_lab-insula | ||
|---|---|---|---|---|---|---|---|---|---|---|---|---|---|---|---|---|---|---|---|---|---|---|
| set | map | |||||||||||||||||||||
| Perception | perception | 3.006862 | -0.478638 | -1.602153 | -0.291847 | -0.881190 | 1.750329 | -1.006959 | 0.516420 | -2.065678 | 3.129380 | ... | -2.621693 | -1.901142 | -1.424181 | 0.614073 | 2.925726 | 1.347830 | -1.755200 | -0.645040 | 3.770319 | 0.803329 |
| visual | 1.947675 | -3.189073 | 0.253227 | 5.266589 | -0.723953 | 5.361512 | 2.553958 | 2.550915 | -1.729785 | 7.115984 | ... | -3.358355 | -1.447393 | -1.182602 | 5.164378 | -0.032817 | 1.055651 | -1.326432 | -0.533767 | 1.209690 | -2.043895 | |
| visuospatial | -0.697603 | -1.306374 | 1.215923 | 0.753205 | 0.032003 | 0.387514 | 2.052910 | -0.072785 | -0.613810 | 1.591849 | ... | -1.628678 | 0.155011 | 0.032063 | 3.934519 | -0.921985 | 0.726252 | -0.679656 | -0.737299 | -0.823943 | -0.874021 | |
| auditory | 6.446041 | -1.969796 | -0.866035 | 0.435678 | -2.823770 | -1.471579 | -1.193045 | -0.478192 | -1.459410 | -0.462926 | ... | -2.817626 | -1.665054 | -1.655000 | -1.596043 | 6.004141 | 0.686664 | -2.536784 | -2.143167 | 8.209537 | 0.980536 | |
| olfactory | -1.618823 | -0.871752 | -1.392784 | -0.793576 | 1.153197 | -0.947827 | -0.945257 | -0.917690 | -0.361134 | -1.149116 | ... | -0.298294 | -0.200353 | -0.443249 | -1.069022 | -0.439401 | 0.155951 | -0.146894 | 1.500918 | -0.262146 | 1.669090 |
5 rows × 68 columns
Between 6 and 14 maps per set
(101, 68)
| hemi-L_lab-bankssts | hemi-L_lab-caudalanteriorcingulate | hemi-L_lab-caudalmiddlefrontal | hemi-L_lab-cuneus | hemi-L_lab-entorhinal | hemi-L_lab-fusiform | hemi-L_lab-inferiorparietal | hemi-L_lab-inferiortemporal | hemi-L_lab-isthmuscingulate | hemi-L_lab-lateraloccipital | ... | hemi-R_lab-rostralanteriorcingulate | hemi-R_lab-rostralmiddlefrontal | hemi-R_lab-superiorfrontal | hemi-R_lab-superiorparietal | hemi-R_lab-superiortemporal | hemi-R_lab-supramarginal | hemi-R_lab-frontalpole | hemi-R_lab-temporalpole | hemi-R_lab-transversetemporal | hemi-R_lab-insula | ||
|---|---|---|---|---|---|---|---|---|---|---|---|---|---|---|---|---|---|---|---|---|---|---|
| set | map | |||||||||||||||||||||
| Perception | perception | 3.006862 | -0.478638 | -1.602153 | -0.291847 | -0.881190 | 1.750329 | -1.006959 | 0.516420 | -2.065678 | 3.129380 | ... | -2.621693 | -1.901142 | -1.424181 | 0.614073 | 2.925726 | 1.347830 | -1.755200 | -0.645040 | 3.770319 | 0.803329 |
| visual | 1.947675 | -3.189073 | 0.253227 | 5.266589 | -0.723953 | 5.361512 | 2.553958 | 2.550915 | -1.729785 | 7.115984 | ... | -3.358355 | -1.447393 | -1.182602 | 5.164378 | -0.032817 | 1.055651 | -1.326432 | -0.533767 | 1.209690 | -2.043895 | |
| visuospatial | -0.697603 | -1.306374 | 1.215923 | 0.753205 | 0.032003 | 0.387514 | 2.052910 | -0.072785 | -0.613810 | 1.591849 | ... | -1.628678 | 0.155011 | 0.032063 | 3.934519 | -0.921985 | 0.726252 | -0.679656 | -0.737299 | -0.823943 | -0.874021 | |
| auditory | 6.446041 | -1.969796 | -0.866035 | 0.435678 | -2.823770 | -1.471579 | -1.193045 | -0.478192 | -1.459410 | -0.462926 | ... | -2.817626 | -1.665054 | -1.655000 | -1.596043 | 6.004141 | 0.686664 | -2.536784 | -2.143167 | 8.209537 | 0.980536 | |
| olfactory | -1.618823 | -0.871752 | -1.392784 | -0.793576 | 1.153197 | -0.947827 | -0.945257 | -0.917690 | -0.361134 | -1.149116 | ... | -0.298294 | -0.200353 | -0.443249 | -1.069022 | -0.439401 | 0.155951 | -0.146894 | 1.500918 | -0.262146 | 1.669090 |
5 rows × 68 columns
Run analysis#
[5]:
from nispace import lgr
from nispace.workflows import simple_colocalization, simple_xsea

colocs, p_values, q_values = {}, {}, {}

# Overview analysis
colocs["mlr_by_set"], p_values["mlr_by_set"], q_values["mlr_by_set"], nsp = simple_xsea(
    x=ref_data,
    y=enigma_data,
    z=None,
    parcellation=parc_name,
    standardize="xyz",
    colocalization_method="mlr",
    permute_kwargs={"what": "maps", "maps_which": "X"},
    n_perm=10000,
    verbose=False,
    n_proc=-1,
    plot=False,
    seed=42
)
print("p values < 0.05 for R2 values by set")
display(p_values["mlr_by_set"]["r2"] < 0.05)

# Single analysis
colocs["spearman"], p_values["spearman"], q_values["spearman"], nsp = simple_colocalization(
    x=ref_data,
    y=enigma_data,
    z=None,
    parcellation=parc_name,
    standardize="xyz",
    colocalization_method="spearman",
    n_perm=10000,
    verbose=False,
    n_proc=-1,
    plot=False,
    seed=42
)
print("p values < 0.05 for Spearman correlation")
display(p_values["spearman"] < 0.05)
INFO | 15/06/25 16:40:46 | nispace: Loading cortex parcellation 'DesikanKilliany' in 'MNI152NLin2009cAsym' space.
INFO | 15/06/25 16:40:46 | nispace: Loaded integrated parcellation with pre-calculated distance matrix.
INFO | 15/06/25 16:40:46 | nispace: Checking input data for 'x' (should be, e.g., PET data):
p values < 0.05 for R2 values by set
| Perception | Attention | Memory | Language | Executive Control | Reward and Learning | Emotion & Affect | Social Cognition | Motor Function | Arousal & State | |
|---|---|---|---|---|---|---|---|---|---|---|
| MDD | False | False | False | False | False | False | False | False | False | False |
| PTSD | False | False | False | False | False | False | False | False | False | False |
| AN | False | False | True | False | False | False | False | True | False | True |
| ADHD | False | False | False | False | False | False | False | False | False | False |
| ASD | False | False | False | False | False | False | False | False | False | False |
| OCD | False | False | True | False | True | False | False | False | False | False |
| BD | False | False | False | False | False | False | False | False | False | False |
| SCZ | False | False | False | False | False | False | False | False | False | False |
| 22q11.2 | False | False | False | False | False | True | False | False | False | False |
| Epilepsy - all | False | True | False | False | True | False | False | False | False | False |
| Epilepsy - temporal | False | False | False | False | False | False | False | False | False | False |
| Epilepsy - generalized | False | True | True | False | True | False | False | True | False | True |
| PD | False | False | True | False | False | False | False | True | False | False |
INFO | 15/06/25 16:41:19 | nispace: Loading cortex parcellation 'DesikanKilliany' in 'MNI152NLin2009cAsym' space.
INFO | 15/06/25 16:41:20 | nispace: Loaded integrated parcellation with pre-calculated distance matrix.
INFO | 15/06/25 16:41:20 | nispace: Checking input data for 'x' (should be, e.g., PET data):
p values < 0.05 for Spearman correlation
| set | Perception | Attention | ... | Motor Function | Arousal & State | ||||||||||||||||
|---|---|---|---|---|---|---|---|---|---|---|---|---|---|---|---|---|---|---|---|---|---|
| map | perception | visual | visuospatial | auditory | olfactory | tactile | pain | sensory | multisensory | attention | ... | eye movements | gaze | grasping | hand movements | arousal | autonomic | eating | interoceptive | sleep | stress |
| MDD | False | False | False | False | False | True | False | True | True | False | ... | True | False | False | True | False | False | True | False | False | False |
| PTSD | False | False | True | False | True | False | False | False | True | True | ... | True | True | True | True | True | False | False | False | False | True |
| AN | False | False | True | False | True | False | False | False | False | True | ... | True | True | True | True | True | False | True | False | True | True |
| ADHD | False | False | False | False | False | False | False | False | False | False | ... | False | False | False | False | False | False | False | False | False | False |
| ASD | True | False | False | False | False | False | False | False | True | False | ... | False | True | False | False | False | False | False | False | False | False |
| OCD | False | False | False | False | False | True | False | True | False | False | ... | False | False | False | False | False | False | False | False | False | False |
| BD | False | False | False | False | False | False | False | False | False | False | ... | False | False | False | False | False | False | False | False | False | False |
| SCZ | False | False | False | False | False | False | False | False | False | False | ... | False | False | False | False | False | False | False | False | False | False |
| 22q11.2 | False | False | True | False | False | False | False | False | False | False | ... | False | False | False | False | False | False | False | False | False | False |
| Epilepsy - all | False | False | True | False | False | False | False | False | False | True | ... | True | True | False | True | False | False | True | False | True | True |
| Epilepsy - temporal | False | False | True | False | False | False | False | False | False | False | ... | True | True | False | False | False | False | False | False | False | False |
| Epilepsy - generalized | False | False | True | False | False | False | False | False | False | False | ... | True | True | False | True | True | False | True | False | True | True |
| PD | False | False | False | False | False | False | True | False | False | False | ... | False | False | False | False | False | False | False | False | False | False |
13 rows × 101 columns
[6]:
from nispace.plotting import heatmap
from nispace.plotting import print_significance
fig, axes = plt.subplots(1,2, figsize=(32,10), gridspec_kw={"width_ratios": [0.1, 1]},
constrained_layout=True)
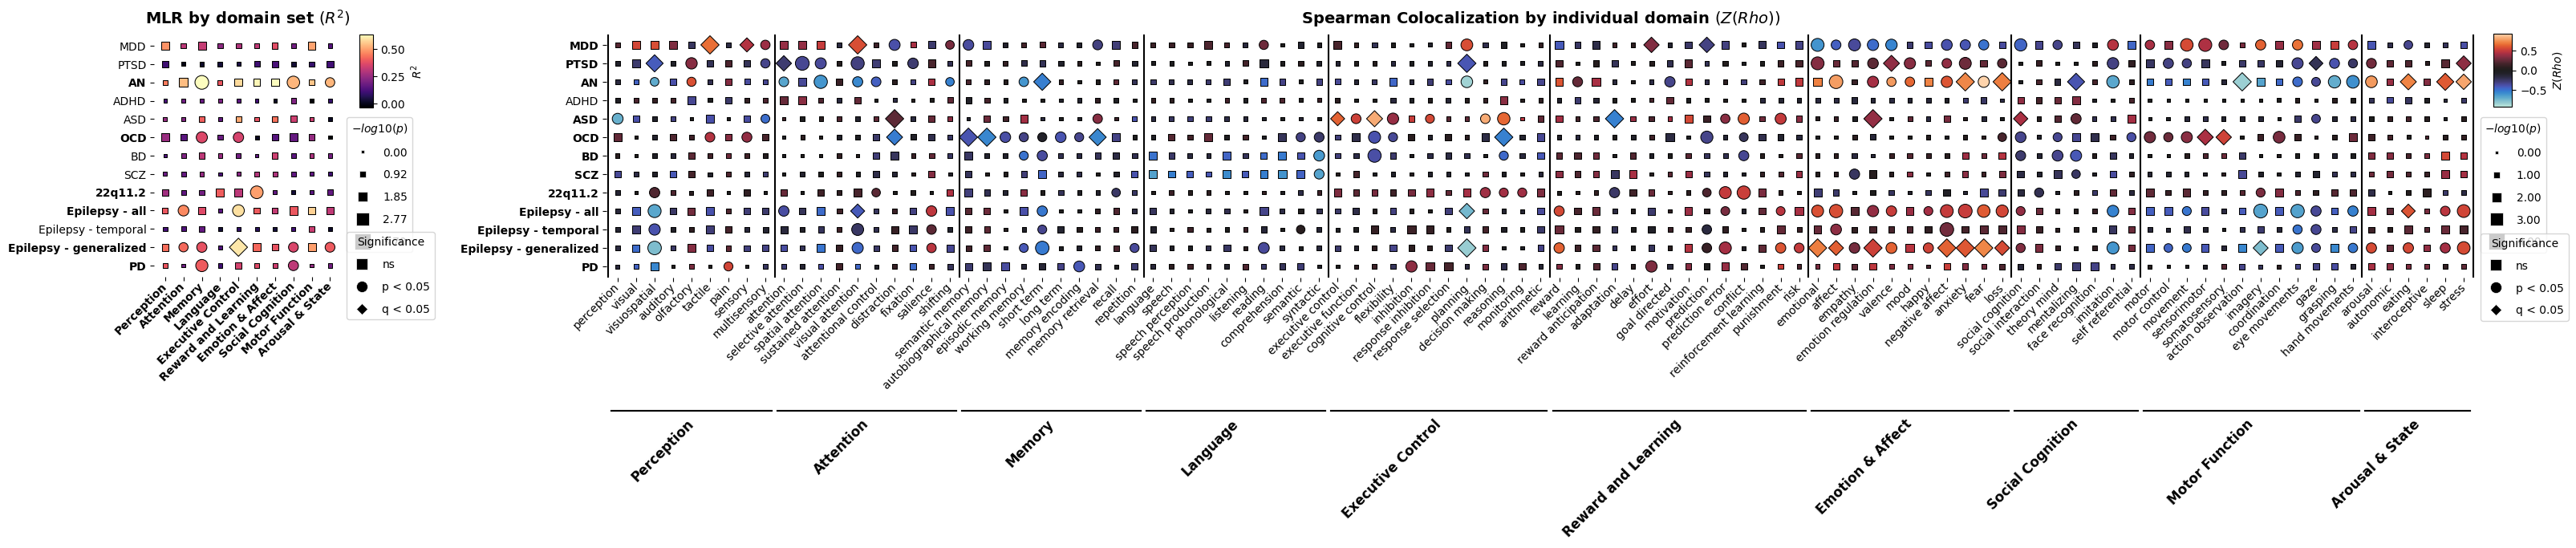
for i, (analysis, stat, title) in enumerate([
("mlr_by_set", "r2", "MLR by domain set $(R^2)$"),
("spearman", "rho", "Spearman Colocalization by individual domain $(Z(Rho))$"),
]):
coloc_df = colocs[analysis][stat] if stat=="r2" else colocs[analysis]
p_df = p_values[analysis][stat] if stat=="r2" else p_values[analysis]
q_df = q_values[analysis][stat] if stat=="r2" else q_values[analysis]
significance_shapes = coloc_df.copy().astype(str)
significance_shapes.iloc[:] = "ns"
significance_shapes = np.where(p_df < 0.05, "p < 0.05", significance_shapes)
significance_shapes = np.where(q_df < 0.05, "q < 0.05", significance_shapes)
axes[i].set_title(title, fontsize=14, fontweight="semibold", pad=10)
heatmap(
ax=axes[i],
data_colors=coloc_df,
data_sizes=-np.log10(p_df),
data_shapes=significance_shapes,
spines=None,
symmetric_cmap=True if stat=="rho" else False,
linewidth=0.05,
ytick_labels=coloc_df.index,
legend_colors_kwargs={
"label": "$Beta$" if "Beta" in title else "$Z(Rho)$" if "Z(Rho)" in title else "$R^2$",
"cax": axes[i].inset_axes((1.1, 0.7, 0.07, 0.3) if stat=="r2" else (1.01, 0.7, 0.01, 0.3))
},
legend_sizes_kwargs={
"title": "$-log10(p)$",
"bbox_to_anchor": (1, 0.38)
},
legend_shapes_kwargs={
"title": "Significance",
"bbox_to_anchor": (1, -0.2)
},
)
axes[i].set_xticks(
np.arange(len(coloc_df.columns)),
labels=coloc_df.columns if stat=="r2" \
else [c[1] for c in coloc_df.columns],
rotation=45,
weight="semibold" if stat=="r2" else "normal"
)
ax = axes[i].inset_axes((0, -0.55, 1, 0.22))
ax.set_xlim(axes[i].get_xlim())
ax.set_ylim(0, 1.05)
ax.set_axis_off()
x = 0
if stat=="rho":
for set_name, set_size in ref_data_maps_pet_set.items():
axes[i].plot((x-0.5, x-0.5), (-0.5, 13), color="k", linestyle="-")
ax.plot((x-0.3, x+set_size-1+0.3), (0, 0), color="k", linestyle="-", lw=3)
ax.text(x+((set_size-1)/2), -0.2, set_name, ha="right", va="center",
rotation=45, rotation_mode="anchor", fontsize=12, fontweight="semibold")
x += set_size
axes[i].plot((x-0.5, x-0.5), (-0.5, 13), color="k", linestyle="-")
print_significance(axes[i], p_values=p_df.min(axis=1))
fig.savefig("enigma_plot_pet.pdf", bbox_inches="tight")
[ ]: